 yuyr
34cb239bf4
yuyr
34cb239bf4
当前部署情况 - h1: 部署server & client - h2: 部署client - 部署2025-11-25 - 部署目录: /home2/argus/server , /home2/argus/client - 部署使用账号:argus 网络拓扑: - h1 作为docker swarm manager - h2 作为worker加入docker swarm - docker swarm 上创建overlay network 访问方式: - 通过ssh到h1服务器,端口转发 20006-20011 端口到笔记本本地; - 门户网址:http://localhost:20006/dashboard 部署截图: 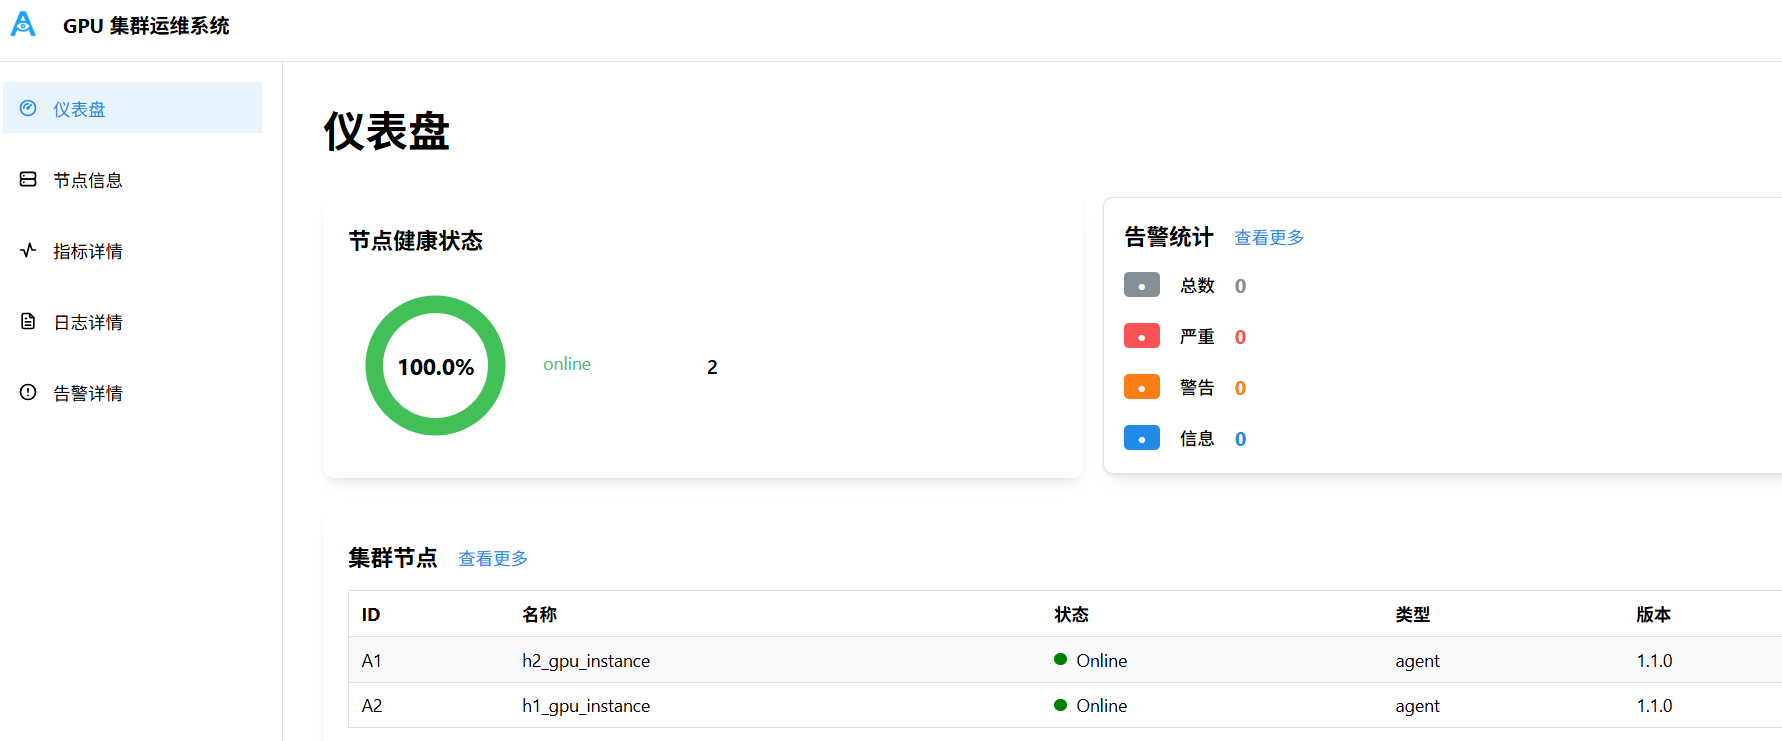 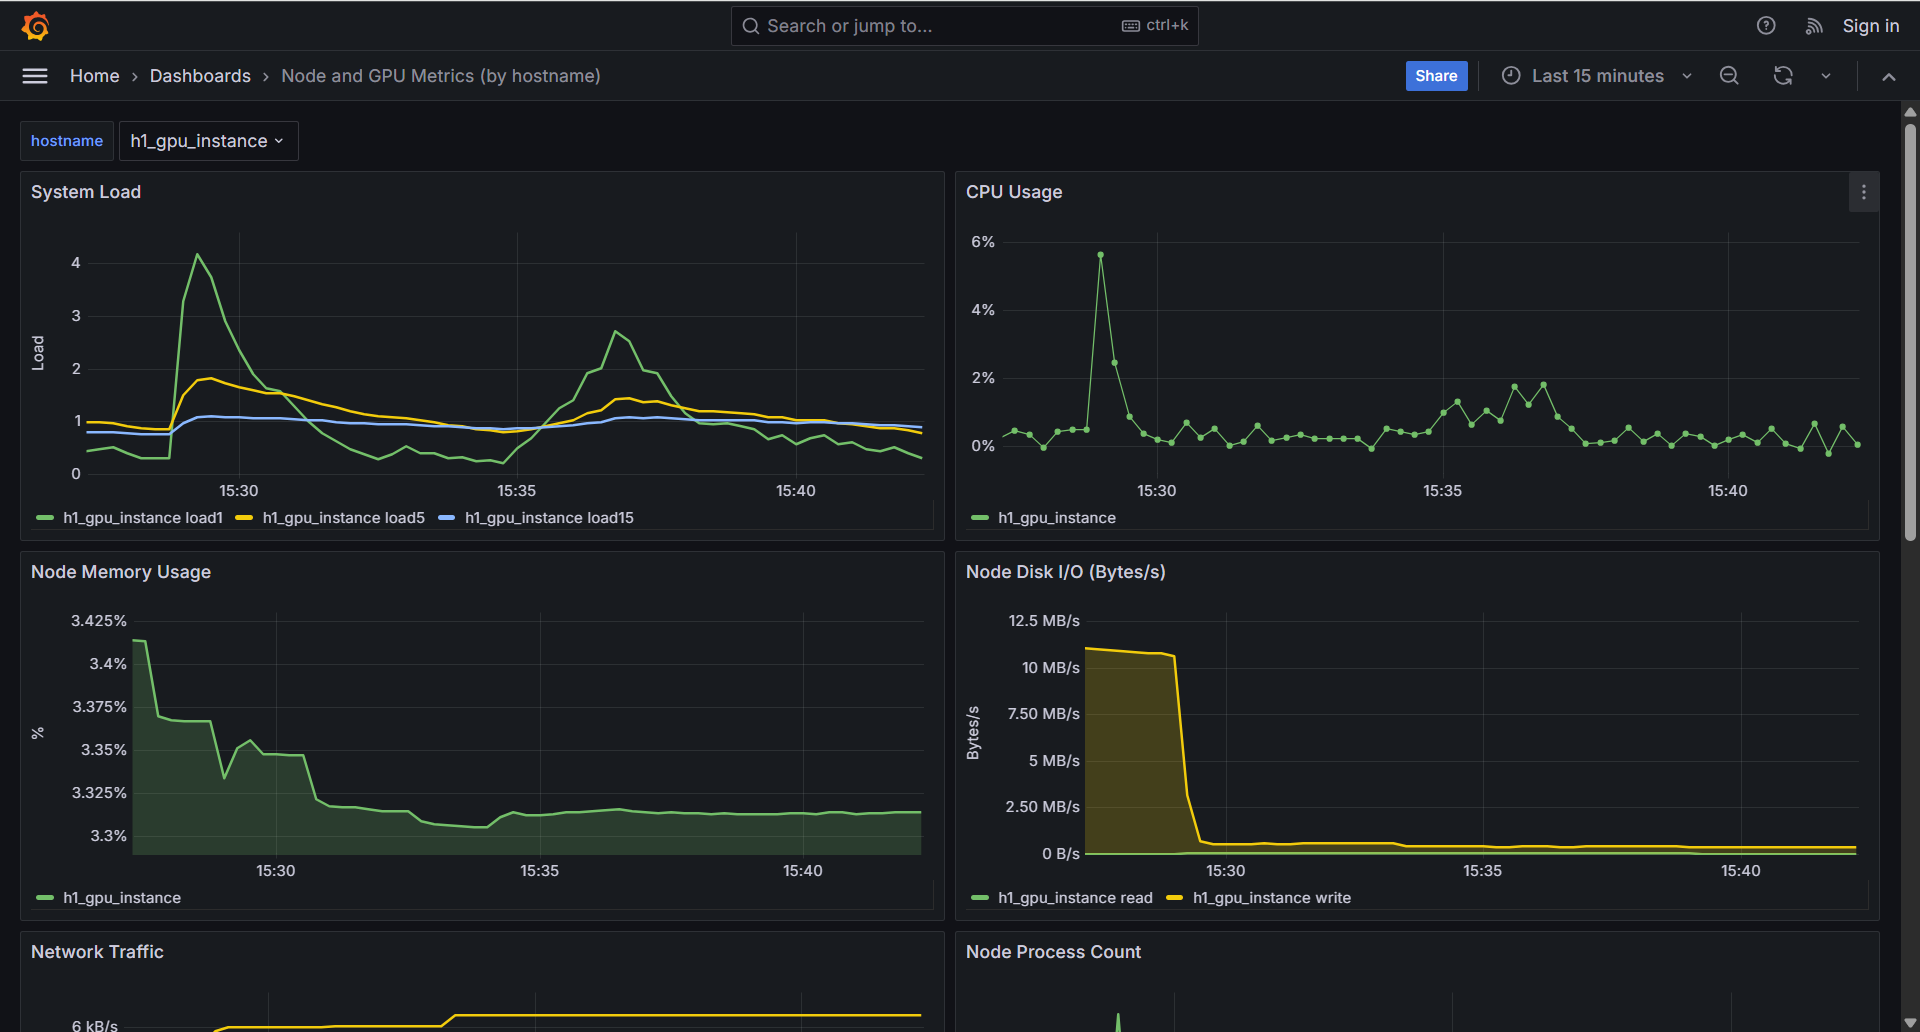 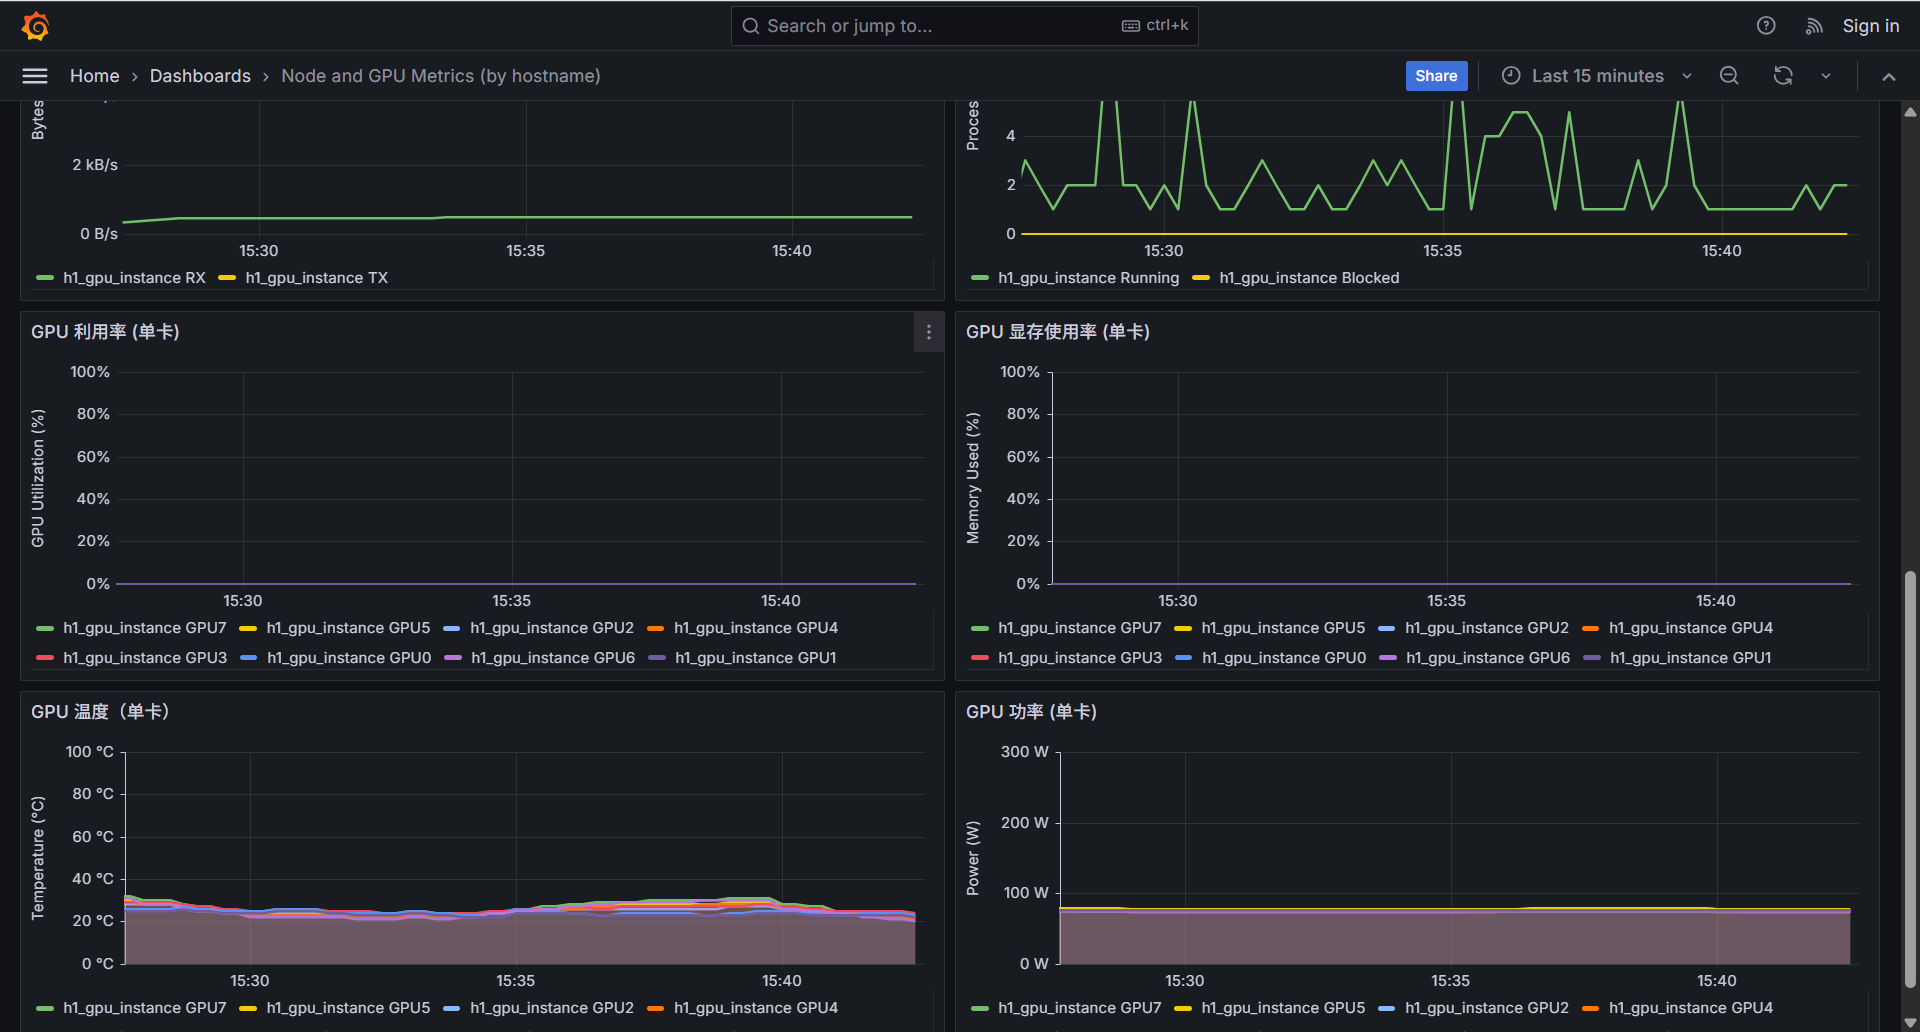 注意事项: - server各容器使用域名作为overlay network上alias别名,实现域名访问,当前版本禁用bind作为域名解析,原因是容器重启后IP变化场景bind机制复杂且不稳定。 - client 构建是内置安装包,容器启动时执行安装流程,后续重启容器跳过安装步骤。 - UID/GID:部署使用 argus账号 uid=2133, gid=2015。 Reviewed-on: #51 Reviewed-by: sundapeng <sundp@mail.zgclab.edu.cn> Reviewed-by: xuxt <xuxt@zgclab.edu.cn> Reviewed-by: huhy <husteryezi@163.com>
104 lines
3.2 KiB
Bash
Executable File
104 lines
3.2 KiB
Bash
Executable File
#!/bin/bash
|
|
# verify_alertmanager.sh
|
|
# Verify the communication between Prometheus and Alertmanager after deployment
|
|
|
|
set -euo pipefail
|
|
|
|
echo "[INFO] Verifying Prometheus ↔ Alertmanager communication..."
|
|
|
|
SCRIPT_DIR="$(cd "$(dirname "${BASH_SOURCE[0]}")" && pwd)"
|
|
TEST_ROOT="$(cd "$SCRIPT_DIR/.." && pwd)"
|
|
TMP_DIR="$TEST_ROOT/tmp"
|
|
mkdir -p "$TMP_DIR"
|
|
|
|
PRIVATE_CORE="$TEST_ROOT/private"
|
|
|
|
#=============================
|
|
# Load environment variables
|
|
#=============================
|
|
if [[ -f "$TEST_ROOT/.env" ]]; then
|
|
set -a; source "$TEST_ROOT/.env"; set +a
|
|
fi
|
|
|
|
#=============================
|
|
# Basic configuration
|
|
#=============================
|
|
PROM_URL="http://localhost:${PROMETHEUS_PORT:-9090}"
|
|
ALERT_URL="http://localhost:${ALERTMANAGER_PORT:-9093}"
|
|
RULE_DIR="$PRIVATE_CORE/argus/metric/prometheus/rules"
|
|
TMP_RULE="$TMP_DIR/test_rule.yml"
|
|
|
|
#=============================
|
|
# Helper functions
|
|
#=============================
|
|
GREEN="\033[32m"; RED="\033[31m"; YELLOW="\033[33m"; RESET="\033[0m"
|
|
|
|
log_info() { echo -e "${YELLOW}[INFO]${RESET} $1"; }
|
|
log_success() { echo -e "${GREEN}[OK]${RESET} $1"; }
|
|
log_warn() { echo -e "${YELLOW}[WARN]${RESET} $1"; }
|
|
log_error() { echo -e "${RED}[ERROR]${RESET} $1"; }
|
|
|
|
fail_exit() { log_error "$1"; exit 1; }
|
|
|
|
#=============================
|
|
# Step 1: Check Alertmanager accessibility
|
|
#=============================
|
|
log_info "Checking Alertmanager status..."
|
|
if curl -sSf "${ALERT_URL}/api/v2/status" >/dev/null 2>&1; then
|
|
log_success "Alertmanager is reachable at ${ALERT_URL}"
|
|
else
|
|
fail_exit "Alertmanager is not reachable. Please check container or port mapping."
|
|
fi
|
|
|
|
#=============================
|
|
# Step 2: Create and load a temporary test alert rule
|
|
#=============================
|
|
log_info "Creating temporary alert rule at ${TMP_RULE}..."
|
|
cat <<EOF > "${TMP_RULE}"
|
|
groups:
|
|
- name: deploy-verify-group
|
|
rules:
|
|
- alert: DeployVerifyAlert
|
|
expr: vector(1)
|
|
labels:
|
|
severity: warning
|
|
annotations:
|
|
summary: "Deployment verification alert"
|
|
EOF
|
|
|
|
mkdir -p "${RULE_DIR}"
|
|
cp "${TMP_RULE}" "${RULE_DIR}/test_rule.yml"
|
|
|
|
log_info "Reloading Prometheus to apply the test rule..."
|
|
if curl -s -X POST "${PROM_URL}/-/reload" >/dev/null; then
|
|
log_success "Prometheus successfully reloaded rules"
|
|
else
|
|
fail_exit "Failed to reload Prometheus. Check API accessibility."
|
|
fi
|
|
|
|
#=============================
|
|
# Step 3: Verify alert received by Alertmanager
|
|
#=============================
|
|
log_info "Waiting for alert propagation (~30 seconds)..."
|
|
sleep 30
|
|
|
|
if curl -s "${ALERT_URL}/api/v2/alerts" | grep -q "DeployVerifyAlert"; then
|
|
log_success "Prometheus → Alertmanager alert path verified successfully"
|
|
else
|
|
fail_exit "DeployVerifyAlert not found in Alertmanager. Check configuration or network."
|
|
fi
|
|
|
|
#=============================
|
|
# Step 4: Cleanup test rule
|
|
#=============================
|
|
log_info "Cleaning up temporary alert rule..."
|
|
rm -f "${RULE_DIR}/test_rule.yml" "${TMP_RULE}"
|
|
|
|
if curl -s -X POST "${PROM_URL}/-/reload" >/dev/null; then
|
|
log_success "Prometheus successfully reloaded after cleanup"
|
|
else
|
|
log_warn "Prometheus reload after cleanup failed. Please check manually."
|
|
fi
|
|
|
|
log_success "Alertmanager verification completed successfully. Communication with Prometheus is healthy."
|