当前部署情况 - h1: 部署server & client - h2: 部署client - 部署2025-11-25 - 部署目录: /home2/argus/server , /home2/argus/client - 部署使用账号:argus 网络拓扑: - h1 作为docker swarm manager - h2 作为worker加入docker swarm - docker swarm 上创建overlay network 访问方式: - 通过ssh到h1服务器,端口转发 20006-20011 端口到笔记本本地; - 门户网址:http://localhost:20006/dashboard 部署截图: 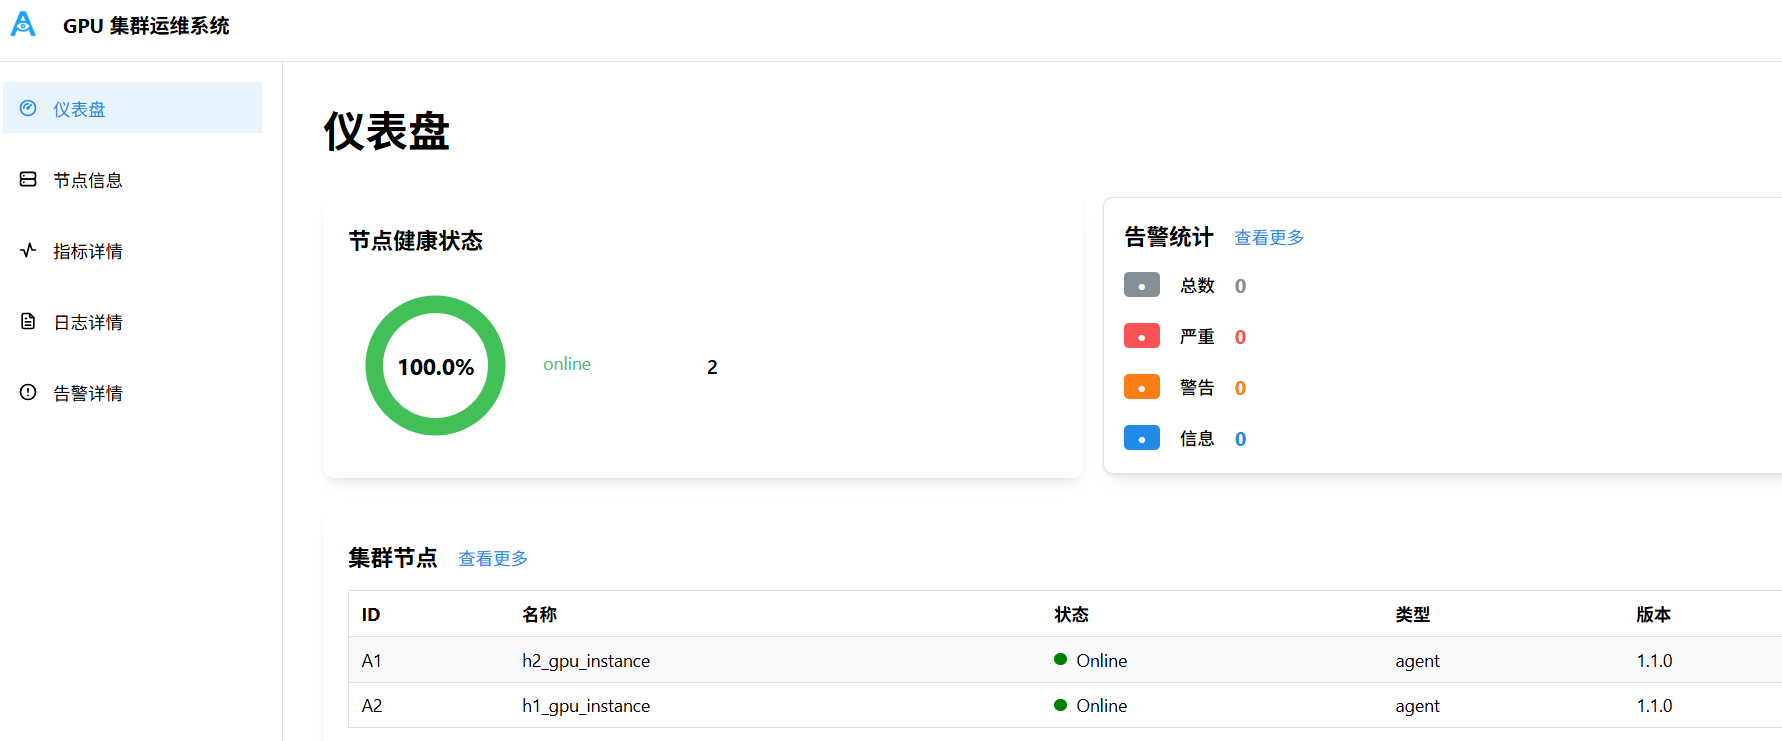 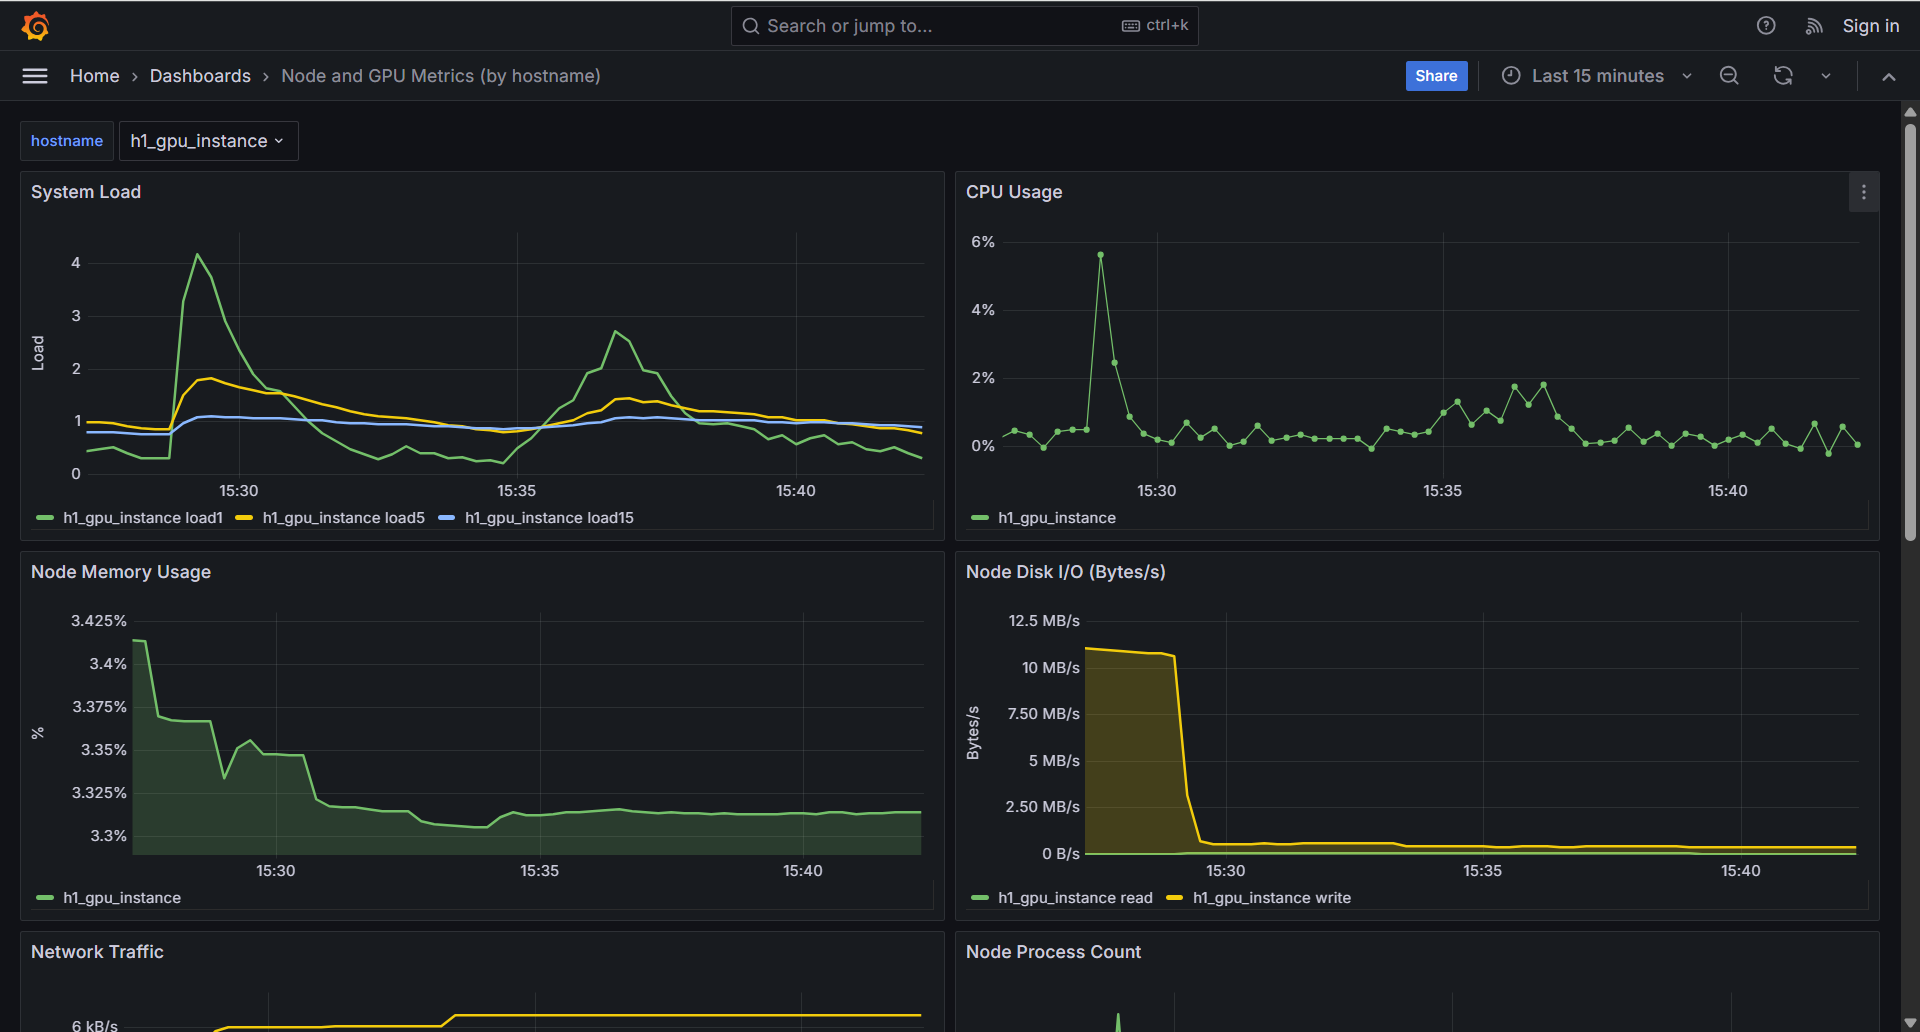 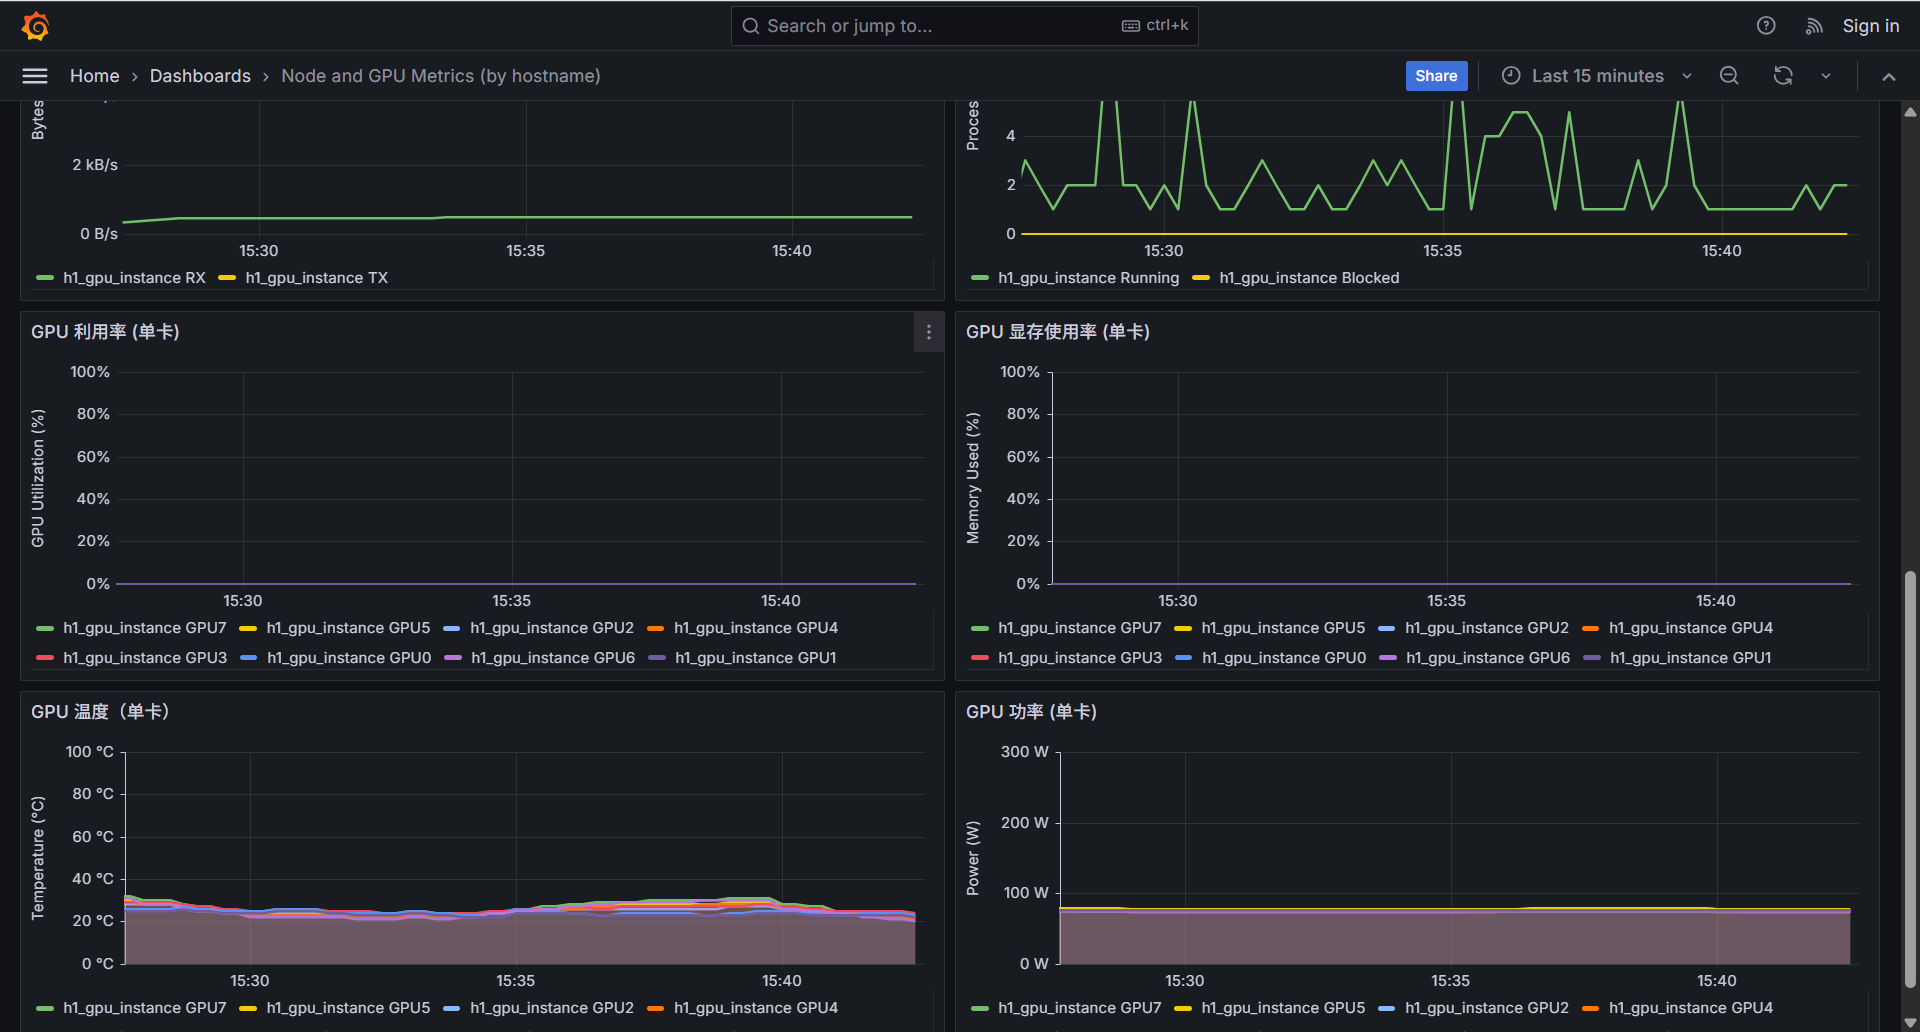 注意事项: - server各容器使用域名作为overlay network上alias别名,实现域名访问,当前版本禁用bind作为域名解析,原因是容器重启后IP变化场景bind机制复杂且不稳定。 - client 构建是内置安装包,容器启动时执行安装流程,后续重启容器跳过安装步骤。 - UID/GID:部署使用 argus账号 uid=2133, gid=2015。 Reviewed-on: #51 Reviewed-by: sundapeng <sundp@mail.zgclab.edu.cn> Reviewed-by: xuxt <xuxt@zgclab.edu.cn> Reviewed-by: huhy <husteryezi@163.com>
269 lines
12 KiB
Bash
Executable File
269 lines
12 KiB
Bash
Executable File
#!/usr/bin/env bash
|
|
set -euo pipefail
|
|
|
|
SCRIPT_DIR="$(cd "$(dirname "${BASH_SOURCE[0]}")" && pwd)"
|
|
ROOT="$(cd "$SCRIPT_DIR/.." && pwd)"
|
|
|
|
ENV_FILE="$ROOT/.env"; [[ -f "$ENV_FILE" ]] && { set -a; source "$ENV_FILE"; set +a; }
|
|
|
|
PROM_PORT="${PROMETHEUS_PORT:-9090}"
|
|
GRAF_PORT="${GRAFANA_PORT:-3000}"
|
|
GRAF_URL="http://127.0.0.1:${GRAF_PORT}"
|
|
PROM_DOMAIN="prom.metric.argus.com:${PROM_PORT}"
|
|
NODE_CONT="${SWARM_NODE_CNAME:-argus-metric-test-node-swarm}"
|
|
|
|
err() { echo "[ERR] $*" >&2; }
|
|
ok() { echo "[OK] $*"; }
|
|
info(){ echo "[INFO] $*"; }
|
|
|
|
fail() { err "$*"; exit 1; }
|
|
|
|
# Ensure fluent-bit is installed, configured and running to ship logs to ES
|
|
# Best-effort remediation for swarm_tests only (does not change repo sources)
|
|
ensure_fluentbit() {
|
|
local cname="$1"
|
|
# 1) ensure process exists or try local bundle installer
|
|
if ! docker exec "$cname" pgrep -x fluent-bit >/dev/null 2>&1; then
|
|
docker exec "$cname" bash -lc '
|
|
set -e
|
|
root=/opt/argus-metric/versions
|
|
ver=$(ls -1 "$root" 2>/dev/null | sort -Vr | head -1 || true)
|
|
[[ -z "$ver" ]] && ver=1.42.0
|
|
verdir="$root/$ver"
|
|
tb=$(ls -1 "$verdir"/fluent-bit-*.tar.gz 2>/dev/null | head -1 || true)
|
|
if [ -n "$tb" ]; then tmp=$(mktemp -d); tar -xzf "$tb" -C "$tmp"; sub=$(find "$tmp" -mindepth 1 -maxdepth 1 -type d | head -n1 || true); [ -n "$sub" ] && (cd "$sub" && ./install.sh "$verdir") || true; fi
|
|
' >/dev/null 2>&1 || true
|
|
fi
|
|
# 2) patch configs using literal placeholders with safe delimiter
|
|
docker exec "$cname" bash -lc '
|
|
set -e
|
|
f=/etc/fluent-bit/fluent-bit.conf
|
|
o=/etc/fluent-bit/outputs.d/10-es.conf
|
|
LCL="\${CLUSTER}"; LRA="\${RACK}"; LHN="\${HOSTNAME}"; EH="\${ES_HOST:-localhost}"; EP="\${ES_PORT:-9200}"
|
|
# record_modifier placeholders
|
|
if grep -q "Record cluster $LCL" "$f"; then sed -i "s|Record cluster $LCL|Record cluster local|" "$f"; fi
|
|
if grep -q "Record rack $LRA" "$f"; then sed -i "s|Record rack $LRA|Record rack dev|" "$f"; fi
|
|
if grep -q "Record host $LHN" "$f"; then hn=$(hostname); sed -i "s|Record host $LHN|Record host ${hn}|" "$f"; fi
|
|
# outputs placeholders
|
|
if [ -f "$o" ] && (grep -q "$EH" "$o" || grep -q "$EP" "$o"); then
|
|
sed -i "s|Host $EH|Host es.log.argus.com|g; s|Port $EP|Port 9200|g" "$o"
|
|
fi
|
|
# ensure parser supports ISO8601 with timezone
|
|
p=/etc/fluent-bit/parsers.conf
|
|
if [ -f "$p" ]; then
|
|
if grep -q "Time_Format %Y-%m-%d %H:%M:%S" "$p"; then
|
|
sed -i "s|Time_Format %Y-%m-%d %H:%M:%S|Time_Format %Y-%m-%dT%H:%M:%S%z|" "$p"
|
|
fi
|
|
if grep -q "Regex ^(?<timestamp>\\d{4}-\\d{2}-\\d{2} \\d{2}:\\d{2}:\\d{2})\\s+" "$p"; then
|
|
sed -i "s|Regex ^(?<timestamp>\\d{4}-\\d{2}-\\d{2} \\d{2}:\\d{2}:\\d{2})\\s+|Regex ^(?<timestamp>\\d{4}-\\d{2}-\\d{2}T\\d{2}:\\d{2}:\\d{2}(?:Z|[+-]\\d{2}:?\\d{2}))\\s+|" "$p"
|
|
fi
|
|
fi
|
|
' >/dev/null 2>&1 || true
|
|
# 3) restart fluent-bit (best-effort) and wait
|
|
docker exec "$cname" bash -lc 'pkill -x fluent-bit >/dev/null 2>&1 || true; sleep 1; setsid su -s /bin/bash fluent-bit -c "/opt/fluent-bit/bin/fluent-bit --config=/etc/fluent-bit/fluent-bit.conf >> /var/log/fluent-bit.log 2>&1" &>/dev/null & echo ok' >/dev/null 2>&1 || true
|
|
for i in {1..10}; do if docker exec "$cname" pgrep -x fluent-bit >/dev/null 2>&1; then return 0; fi; sleep 1; done
|
|
echo "[WARN] fluent-bit not confirmed running; log pipeline may not ingest" >&2
|
|
}
|
|
|
|
# ---- Grafana /api/health ----
|
|
info "Grafana /api/health"
|
|
HEALTH_JSON="$ROOT/tmp/metric-verify/graf_health.json"
|
|
mkdir -p "$(dirname "$HEALTH_JSON")"
|
|
code=$(curl -fsS -o "$HEALTH_JSON" -w '%{http_code}' --max-time 10 "$GRAF_URL/api/health" || true)
|
|
[[ "$code" == 200 ]] || fail "/api/health HTTP $code"
|
|
if grep -q '"database"\s*:\s*"ok"' "$HEALTH_JSON"; then ok "grafana health database=ok"; else fail "grafana health not ok: $(cat "$HEALTH_JSON")"; fi
|
|
|
|
# ---- Grafana datasource points to prom domain ----
|
|
info "Grafana datasource URL uses domain: $PROM_DOMAIN"
|
|
DS_FILE="/private/argus/metric/grafana/provisioning/datasources/datasources.yml"
|
|
if ! docker exec argus-grafana sh -lc "test -f $DS_FILE" >/dev/null 2>&1; then
|
|
DS_FILE="/etc/grafana/provisioning/datasources/datasources.yml"
|
|
fi
|
|
docker exec argus-grafana sh -lc "grep -E 'url:\s*http://$PROM_DOMAIN' '$DS_FILE'" >/dev/null 2>&1 || fail "datasource not pointing to $PROM_DOMAIN"
|
|
ok "datasource points to domain"
|
|
|
|
# ---- DNS resolution inside grafana (via Docker DNS + FQDN alias) ----
|
|
info "FQDN resolution inside grafana (Docker DNS)"
|
|
tries=0
|
|
until docker exec argus-grafana getent hosts prom.metric.argus.com >/dev/null 2>&1; do
|
|
tries=$((tries+1)); (( tries > 24 )) && fail "grafana cannot resolve prom.metric.argus.com"
|
|
echo "[..] waiting DNS propagation in grafana ($tries/24)"; sleep 5
|
|
done
|
|
ok "domain resolves"
|
|
|
|
# ---- Prometheus activeTargets down check ----
|
|
info "Prometheus activeTargets health"
|
|
targets_json="$ROOT/tmp/metric-verify/prom_targets.json"
|
|
curl -fsS "http://127.0.0.1:${PROM_PORT}/api/v1/targets" -o "$targets_json" || { echo "[WARN] fetch targets failed" >&2; }
|
|
down_all=""
|
|
if command -v jq >/dev/null 2>&1; then
|
|
down_all=$(jq -r '.data.activeTargets[] | select(.health=="down") | .scrapeUrl' "$targets_json" 2>/dev/null || true)
|
|
else
|
|
down_all=$(grep -o '"scrapeUrl":"[^"]\+"' "$targets_json" | sed 's/"scrapeUrl":"\(.*\)"/\1/' | paste -sd '\n' - | grep -v '^$' || true)
|
|
grep -q '"health":"down"' "$targets_json" && [ -z "$down_all" ] && down_all="(one or more targets down)"
|
|
fi
|
|
# ignore dcgm-exporter(9400) and tolerate node-exporter(9100) in swarm tests
|
|
down_filtered=$(echo "$down_all" | grep -Ev ':(9400|9100)/' || true)
|
|
if [[ -n "$down_filtered" ]]; then
|
|
err "prometheus down targets (filtered):"; echo "$down_filtered" >&2
|
|
else
|
|
ok "prometheus targets up (ignoring :9100 and :9400)"
|
|
fi
|
|
|
|
# ---- nodes.json sanity: avoid 172.22/16 (gwbridge) ----
|
|
nodes_json="$ROOT/private-server/argus/metric/prometheus/nodes.json"
|
|
if [[ -f "$nodes_json" ]] && grep -q '"ip"\s*:\s*"172\.22\.' "$nodes_json"; then
|
|
fail "nodes.json contains 172.22/16 addresses (gwbridge)"
|
|
fi
|
|
ok "nodes.json IPs look fine"
|
|
|
|
echo "[DONE] metric verify"
|
|
|
|
# ---- Log pipeline smoke test (adapted from sys/tests 07) ----
|
|
info "Log pipeline: send logs in node container and assert ES counts"
|
|
|
|
ES_PORT="${ES_HTTP_PORT:-9200}"
|
|
KIBANA_PORT="${KIBANA_PORT:-5601}"
|
|
|
|
get_count() {
|
|
local idx="$1"; local tmp; tmp=$(mktemp)
|
|
local code
|
|
code=$(curl -s -o "$tmp" -w "%{http_code}" "http://127.0.0.1:${ES_PORT}/${idx}/_count?ignore_unavailable=true&allow_no_indices=true" || true)
|
|
if [[ "$code" == "200" ]]; then
|
|
local val
|
|
val=$(jq -r '(.count // 0) | tonumber? // 0' "$tmp" 2>/dev/null || echo 0)
|
|
echo "$val"
|
|
else
|
|
echo 0
|
|
fi
|
|
rm -f "$tmp"
|
|
}
|
|
|
|
train0=$(get_count "train-*")
|
|
infer0=$(get_count "infer-*")
|
|
base=$((train0 + infer0))
|
|
info "initial ES counts: train=${train0} infer=${infer0} total=${base}"
|
|
|
|
send_logs() {
|
|
local cname="$1"; local hosttag="$2"
|
|
docker exec "$cname" sh -lc 'mkdir -p /logs/train /logs/infer'
|
|
docker exec "$cname" sh -lc "ts=\$(date -u +%Y-%m-%dT%H:%M:%SZ); echo \"\$ts INFO [$hosttag] training step=1 loss=1.23 model=bert\" >> /logs/train/train-demo.log"
|
|
docker exec "$cname" sh -lc "ts=\$(date -u +%Y-%m-%dT%H:%M:%SZ); echo \"\$ts INFO [$hosttag] training step=2 loss=1.10 model=bert\" >> /logs/train/train-demo.log"
|
|
docker exec "$cname" sh -lc "ts=\$(date -u +%Y-%m-%dT%H:%M:%SZ); echo \"\$ts WARN [$hosttag] inference slow on batch=2 latency=1.9s\" >> /logs/infer/infer-demo.log"
|
|
}
|
|
|
|
ensure_fluentbit "$NODE_CONT"
|
|
# ensure fluent-bit process is really up before sending logs,
|
|
# to avoid dropping lines when tail starts after we write test logs
|
|
FLUENT_WAIT_RETRIES="${FLUENT_WAIT_RETRIES:-120}"
|
|
FLUENT_WAIT_SLEEP="${FLUENT_WAIT_SLEEP:-2}"
|
|
fluent_ok=0
|
|
for i in $(seq 1 "$FLUENT_WAIT_RETRIES"); do
|
|
if docker exec "$NODE_CONT" pgrep -x fluent-bit >/dev/null 2>&1; then
|
|
fluent_ok=1
|
|
break
|
|
fi
|
|
echo "[..] waiting fluent-bit process up in node ($i/$FLUENT_WAIT_RETRIES)"
|
|
sleep "$FLUENT_WAIT_SLEEP"
|
|
done
|
|
if [[ "$fluent_ok" -ne 1 ]]; then
|
|
fail "fluent-bit not running in node after waiting $((FLUENT_WAIT_RETRIES * FLUENT_WAIT_SLEEP))s"
|
|
fi
|
|
send_logs "$NODE_CONT" "swarm-node"
|
|
|
|
info "waiting for ES to ingest..."
|
|
curl -s -X POST "http://127.0.0.1:${ES_PORT}/train-*/_refresh" >/dev/null 2>&1 || true
|
|
curl -s -X POST "http://127.0.0.1:${ES_PORT}/infer-*/_refresh" >/dev/null 2>&1 || true
|
|
|
|
final=0; threshold=3
|
|
for attempt in {1..60}; do
|
|
train1=$(get_count "train-*"); infer1=$(get_count "infer-*"); final=$((train1 + infer1))
|
|
if (( final > base && final >= threshold )); then break; fi
|
|
echo "[..] waiting ES counts increase to >=${threshold} ($attempt/60) current=${final} base=${base}"; \
|
|
curl -s -X POST "http://127.0.0.1:${ES_PORT}/train-*/_refresh" >/dev/null 2>&1 || true; \
|
|
curl -s -X POST "http://127.0.0.1:${ES_PORT}/infer-*/_refresh" >/dev/null 2>&1 || true; \
|
|
sleep 2
|
|
done
|
|
info "final ES counts: train=${train1} infer=${infer1} total=${final}"
|
|
|
|
(( final > base )) || fail "ES total did not increase (${base} -> ${final})"
|
|
(( final >= threshold )) || fail "ES total below expected threshold: ${final} < ${threshold}"
|
|
|
|
es_health=$(curl -s "http://127.0.0.1:${ES_PORT}/_cluster/health" | grep -o '"status":"[^\"]*"' | cut -d'"' -f4)
|
|
[[ "$es_health" == green || "$es_health" == yellow ]] || fail "ES health not green/yellow: $es_health"
|
|
|
|
if ! curl -fs "http://127.0.0.1:${KIBANA_PORT}/api/status" >/dev/null 2>&1; then
|
|
echo "[WARN] Kibana status endpoint not available" >&2
|
|
fi
|
|
|
|
ok "log pipeline verified"
|
|
|
|
# ---- Node status and health (node.json + metric-*) ----
|
|
info "Node status and health (node.json + metric components)"
|
|
|
|
NODE_HEALTH_RETRIES="${NODE_HEALTH_RETRIES:-5}"
|
|
NODE_HEALTH_SLEEP="${NODE_HEALTH_SLEEP:-5}"
|
|
|
|
if ! command -v jq >/dev/null 2>&1; then
|
|
fail "node health: jq not available on host; cannot parse node.json"
|
|
fi
|
|
|
|
node_health_ok=0
|
|
for attempt in $(seq 1 "$NODE_HEALTH_RETRIES"); do
|
|
tmp_node_json="$(mktemp)"
|
|
if ! docker exec "$NODE_CONT" sh -lc '
|
|
set -e
|
|
host="$(hostname)"
|
|
f="/private/argus/agent/${host}/node.json"
|
|
if [ ! -s "$f" ]; then
|
|
echo "[ERR] node.json missing or empty: $f" >&2
|
|
exit 1
|
|
fi
|
|
cat "$f"
|
|
' > "$tmp_node_json" 2>/dev/null; then
|
|
rm -f "$tmp_node_json"
|
|
info "node health: node.json not ready (attempt $attempt/$NODE_HEALTH_RETRIES)"
|
|
else
|
|
node_name="$(jq -r '.name // ""' "$tmp_node_json")"
|
|
node_status="$(jq -r '.status // ""' "$tmp_node_json")"
|
|
node_type="$(jq -r '.type // ""' "$tmp_node_json")"
|
|
|
|
if [[ -z "$node_name" || -z "$node_status" || -z "$node_type" ]]; then
|
|
info "node health: missing required fields in node.json (attempt $attempt/$NODE_HEALTH_RETRIES)"
|
|
elif [[ "$node_status" != "online" || "$node_type" != "agent" ]]; then
|
|
info "node health: status/type not ready yet (status=$node_status type=$node_type name=$node_name attempt $attempt/$NODE_HEALTH_RETRIES)"
|
|
else
|
|
all_ok=1
|
|
for comp in metric-argus-agent metric-node-exporter metric-dcgm-exporter metric-fluent-bit; do
|
|
cstatus="$(jq -r --arg c "$comp" '.health[$c].status // ""' "$tmp_node_json")"
|
|
cerror="$(jq -r --arg c "$comp" '.health[$c].error // ""' "$tmp_node_json")"
|
|
if [[ "$cstatus" != "healthy" ]]; then
|
|
info "node health: $comp status=$cstatus (attempt $attempt/$NODE_HEALTH_RETRIES)"
|
|
all_ok=0
|
|
break
|
|
fi
|
|
if [[ -n "$cerror" && "$cerror" != "null" ]]; then
|
|
info "node health: $comp error=$cerror (attempt $attempt/$NODE_HEALTH_RETRIES)"
|
|
all_ok=0
|
|
break
|
|
fi
|
|
done
|
|
if [[ "$all_ok" -eq 1 ]]; then
|
|
node_health_ok=1
|
|
rm -f "$tmp_node_json"
|
|
break
|
|
fi
|
|
fi
|
|
rm -f "$tmp_node_json"
|
|
fi
|
|
if [[ "$attempt" -lt "$NODE_HEALTH_RETRIES" ]]; then
|
|
sleep "$NODE_HEALTH_SLEEP"
|
|
fi
|
|
done
|
|
|
|
if [[ "$node_health_ok" -ne 1 ]]; then
|
|
fail "node health: node.json or metric components not healthy after ${NODE_HEALTH_RETRIES} attempts"
|
|
fi
|
|
|
|
ok "node status online and metric components healthy"
|