当前部署情况 - h1: 部署server & client - h2: 部署client - 部署2025-11-25 - 部署目录: /home2/argus/server , /home2/argus/client - 部署使用账号:argus 网络拓扑: - h1 作为docker swarm manager - h2 作为worker加入docker swarm - docker swarm 上创建overlay network 访问方式: - 通过ssh到h1服务器,端口转发 20006-20011 端口到笔记本本地; - 门户网址:http://localhost:20006/dashboard 部署截图: 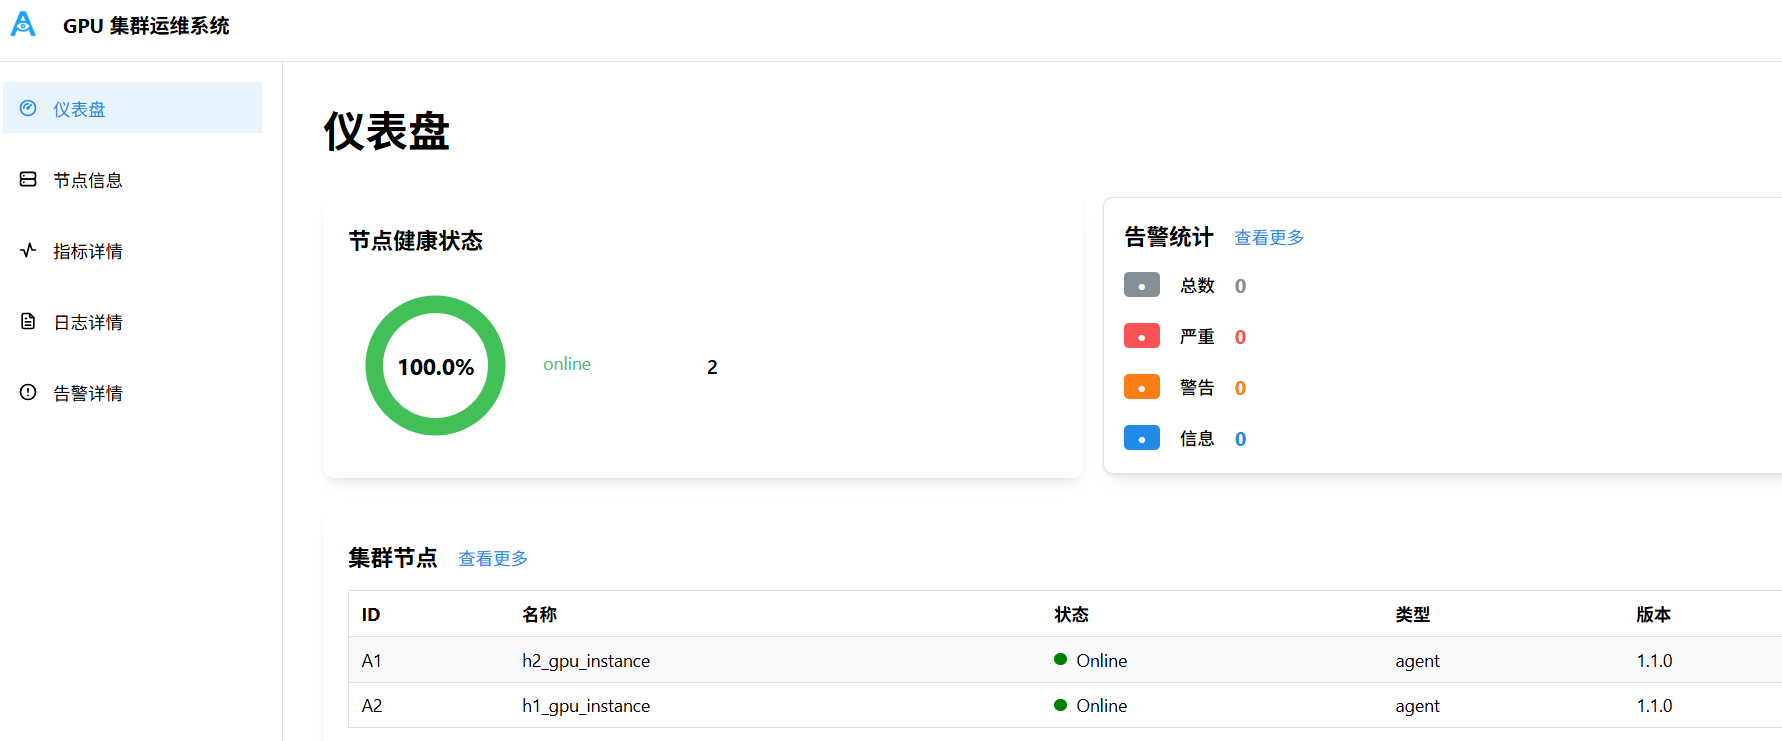 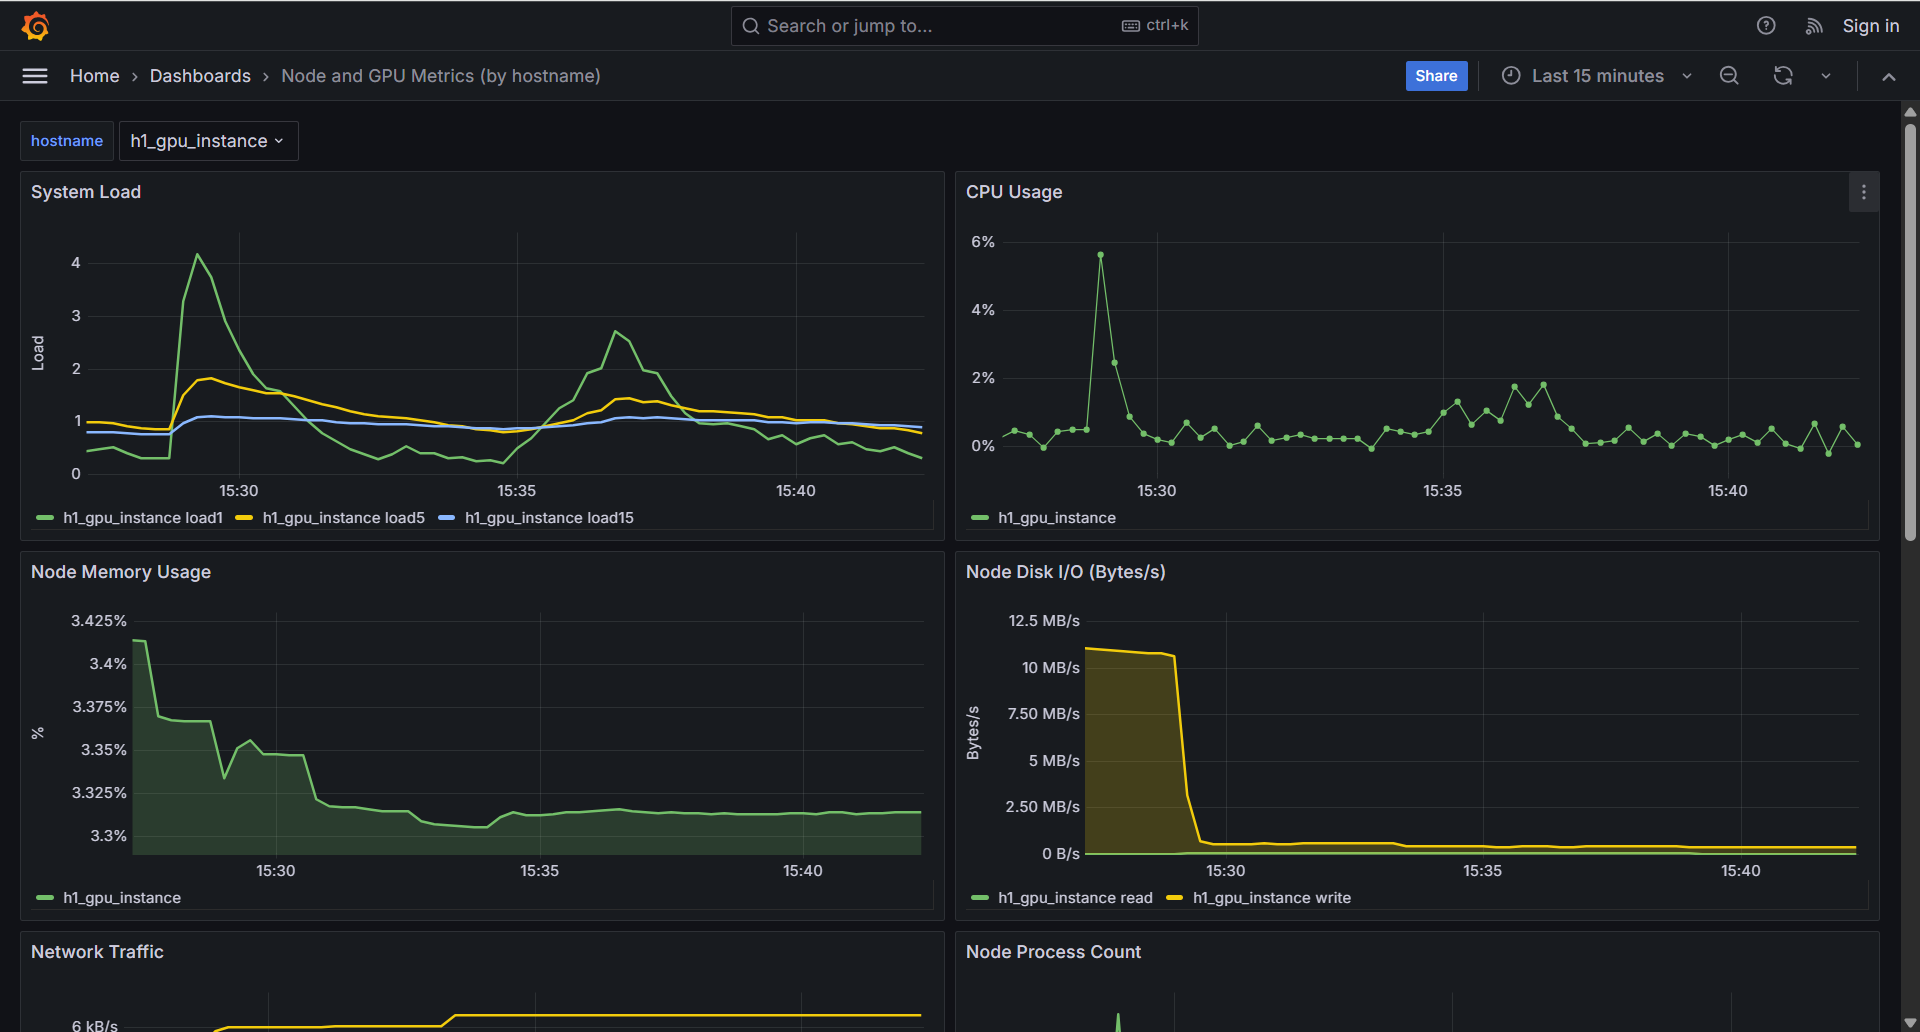 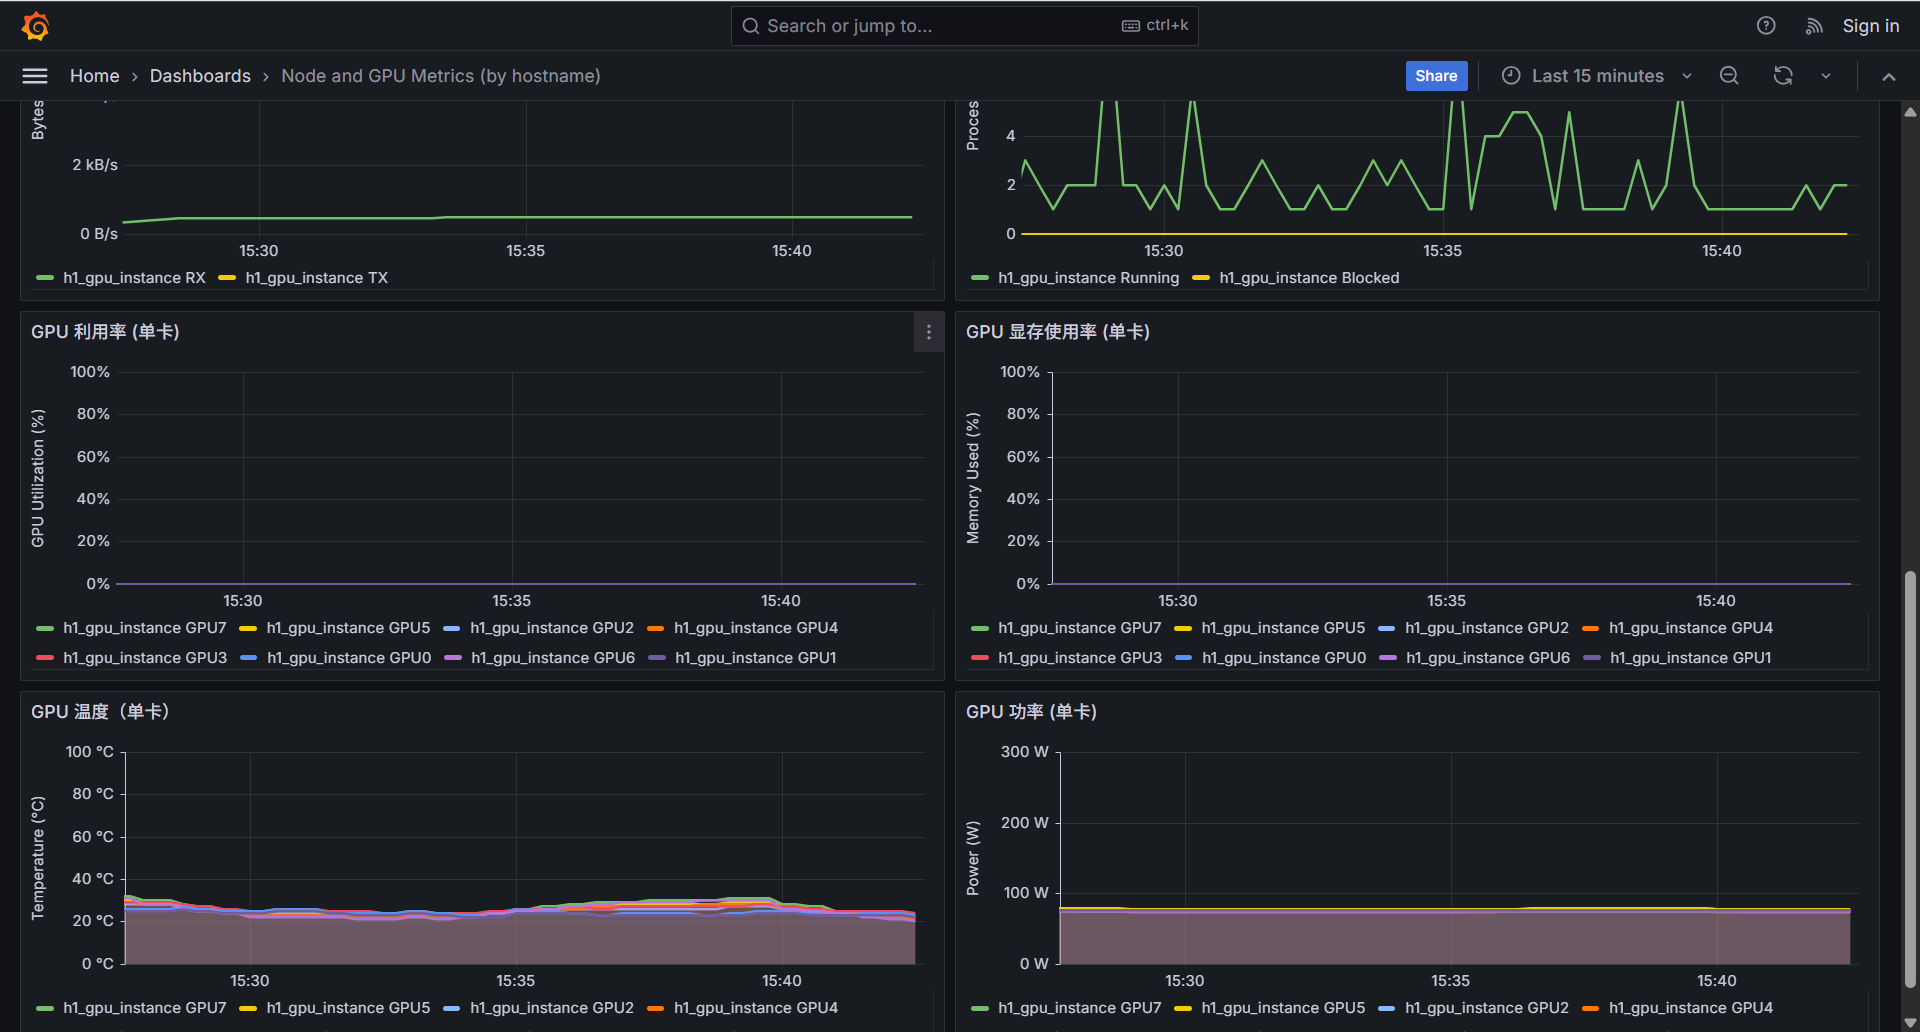 注意事项: - server各容器使用域名作为overlay network上alias别名,实现域名访问,当前版本禁用bind作为域名解析,原因是容器重启后IP变化场景bind机制复杂且不稳定。 - client 构建是内置安装包,容器启动时执行安装流程,后续重启容器跳过安装步骤。 - UID/GID:部署使用 argus账号 uid=2133, gid=2015。 Reviewed-on: #51 Reviewed-by: sundapeng <sundp@mail.zgclab.edu.cn> Reviewed-by: xuxt <xuxt@zgclab.edu.cn> Reviewed-by: huhy <husteryezi@163.com>
84 lines
3.0 KiB
Bash
84 lines
3.0 KiB
Bash
#!/usr/bin/env bash
|
|
set -euo pipefail
|
|
|
|
SCRIPT_DIR="$(cd "$(dirname "${BASH_SOURCE[0]}")" && pwd)"
|
|
ROOT="$(cd "$SCRIPT_DIR/.." && pwd)"
|
|
|
|
log() { echo -e "\033[0;34m[CHECK]\033[0m $*"; }
|
|
err() { echo -e "\033[0;31m[ERROR]\033[0m $*" >&2; }
|
|
|
|
ENV_FILE="$ROOT/compose/.env"; [[ -f "$ENV_FILE" ]] && set -a && source "$ENV_FILE" && set +a
|
|
|
|
wait_http() { local url="$1"; local attempts=${2:-120}; local i=1; while ((i<=attempts)); do curl -fsS "$url" >/dev/null 2>&1 && return 0; echo "[..] waiting $url ($i/$attempts)"; sleep 5; ((i++)); done; return 1; }
|
|
code_for() { curl -s -o /dev/null -w "%{http_code}" "$1" || echo 000; }
|
|
header_val() { curl -s -D - -o /dev/null "$@" | awk -F': ' 'BEGIN{IGNORECASE=1}$1=="Access-Control-Allow-Origin"{gsub("\r","",$2);print $2}'; }
|
|
|
|
LOG_DIR="$ROOT/logs"; mkdir -p "$LOG_DIR" || true
|
|
OUT_JSON="$LOG_DIR/selfcheck.json"; tmp=$(mktemp)
|
|
|
|
ok=1
|
|
|
|
log "checking overlay network"
|
|
net_ok=false
|
|
if docker network inspect "${ARGUS_OVERLAY_NET:-argus-sys-net}" >/dev/null 2>&1; then
|
|
if docker network inspect "${ARGUS_OVERLAY_NET:-argus-sys-net}" | grep -q '"Driver": "overlay"'; then net_ok=true; fi
|
|
fi
|
|
[[ "$net_ok" == true ]] || ok=0
|
|
|
|
log "checking Elasticsearch"
|
|
wait_http "http://localhost:${ES_HTTP_PORT:-9200}/_cluster/health" 60 || ok=0
|
|
|
|
log "checking Kibana"
|
|
kb_code=$(code_for "http://localhost:${KIBANA_PORT:-5601}/api/status")
|
|
kb_ok=false
|
|
if [[ "$kb_code" == 200 ]]; then
|
|
body=$(curl -sS "http://localhost:${KIBANA_PORT:-5601}/api/status" || true)
|
|
echo "$body" | grep -q '"level"\s*:\s*"available"' && kb_ok=true
|
|
fi
|
|
[[ "$kb_ok" == true ]] || ok=0
|
|
|
|
log "checking Master"
|
|
[[ $(code_for "http://localhost:${MASTER_PORT:-32300}/readyz") == 200 ]] || ok=0
|
|
|
|
log "checking Prometheus"
|
|
wait_http "http://localhost:${PROMETHEUS_PORT:-9090}/-/ready" 60 || ok=0
|
|
|
|
log "checking Grafana"
|
|
gf_code=$(code_for "http://localhost:${GRAFANA_PORT:-3000}/api/health")
|
|
gf_ok=false; if [[ "$gf_code" == 200 ]]; then body=$(curl -sS "http://localhost:${GRAFANA_PORT:-3000}/api/health" || true); echo "$body" | grep -q '"database"\s*:\s*"ok"' && gf_ok=true; fi
|
|
[[ "$gf_ok" == true ]] || ok=0
|
|
|
|
log "checking Alertmanager"
|
|
wait_http "http://localhost:${ALERTMANAGER_PORT:-9093}/api/v2/status" 60 || ok=0
|
|
|
|
log "checking Web-Proxy (CORS)"
|
|
cors8084=$(header_val -H "Origin: http://localhost:${WEB_PROXY_PORT_8080:-8080}" "http://localhost:${WEB_PROXY_PORT_8084:-8084}/api/v2/status" || true)
|
|
cors8085=$(header_val -H "Origin: http://localhost:${WEB_PROXY_PORT_8080:-8080}" "http://localhost:${WEB_PROXY_PORT_8085:-8085}/api/v1/master/nodes" || true)
|
|
wp_ok=true
|
|
[[ -n "$cors8084" && -n "$cors8085" ]] || wp_ok=false
|
|
[[ "$wp_ok" == true ]] || ok=0
|
|
|
|
cat > "$tmp" <<JSON
|
|
{
|
|
"overlay_net": $net_ok,
|
|
"es": true,
|
|
"kibana": $kb_ok,
|
|
"master_readyz": true,
|
|
"prometheus": true,
|
|
"grafana": $gf_ok,
|
|
"alertmanager": true,
|
|
"web_proxy_cors": $wp_ok,
|
|
"timestamp": "$(date -u +%Y-%m-%dT%H:%M:%SZ)"
|
|
}
|
|
JSON
|
|
|
|
mv "$tmp" "$OUT_JSON" 2>/dev/null || cp "$tmp" "$OUT_JSON"
|
|
|
|
if [[ "$ok" == 1 ]]; then
|
|
log "selfcheck OK -> $OUT_JSON"
|
|
exit 0
|
|
else
|
|
err "selfcheck FAILED -> $OUT_JSON"
|
|
exit 1
|
|
fi
|