 yuyr
59a38513a4
yuyr
59a38513a4
测试方案: - lm2机器端口映射到本机:18080, 18081, 8082-8085 - 访问URL: http://localhost:18080/dashboard 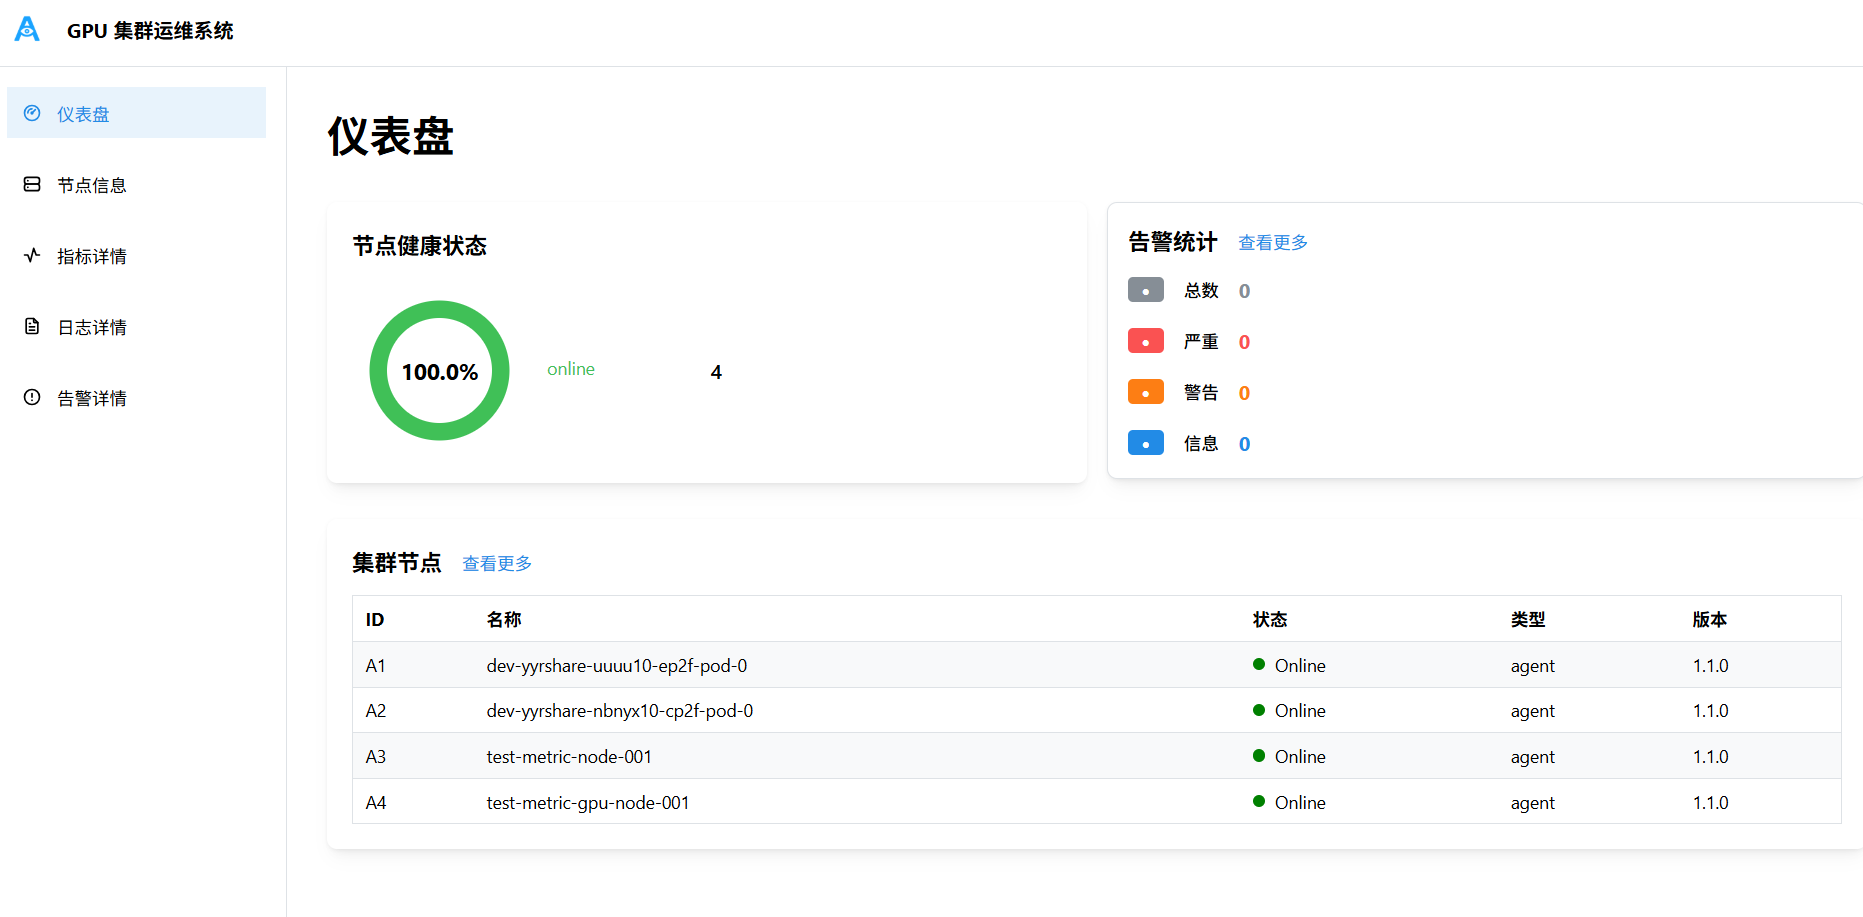 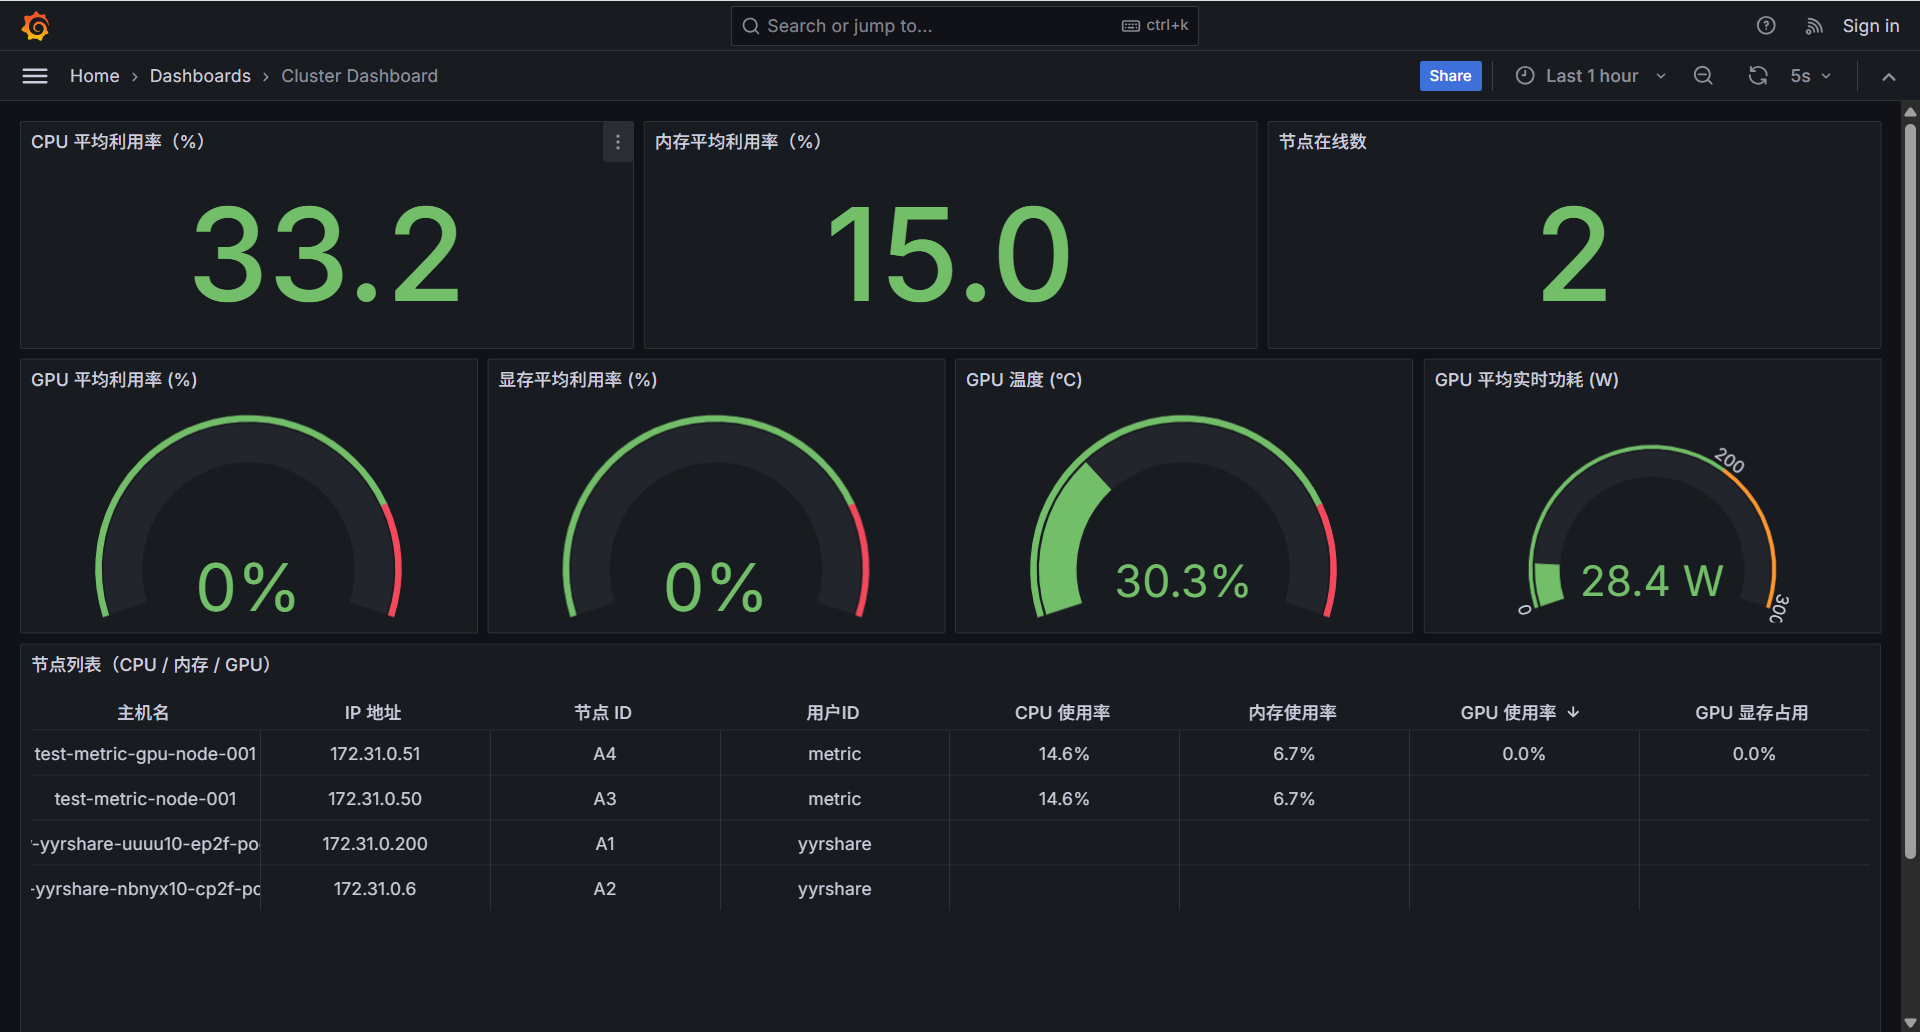 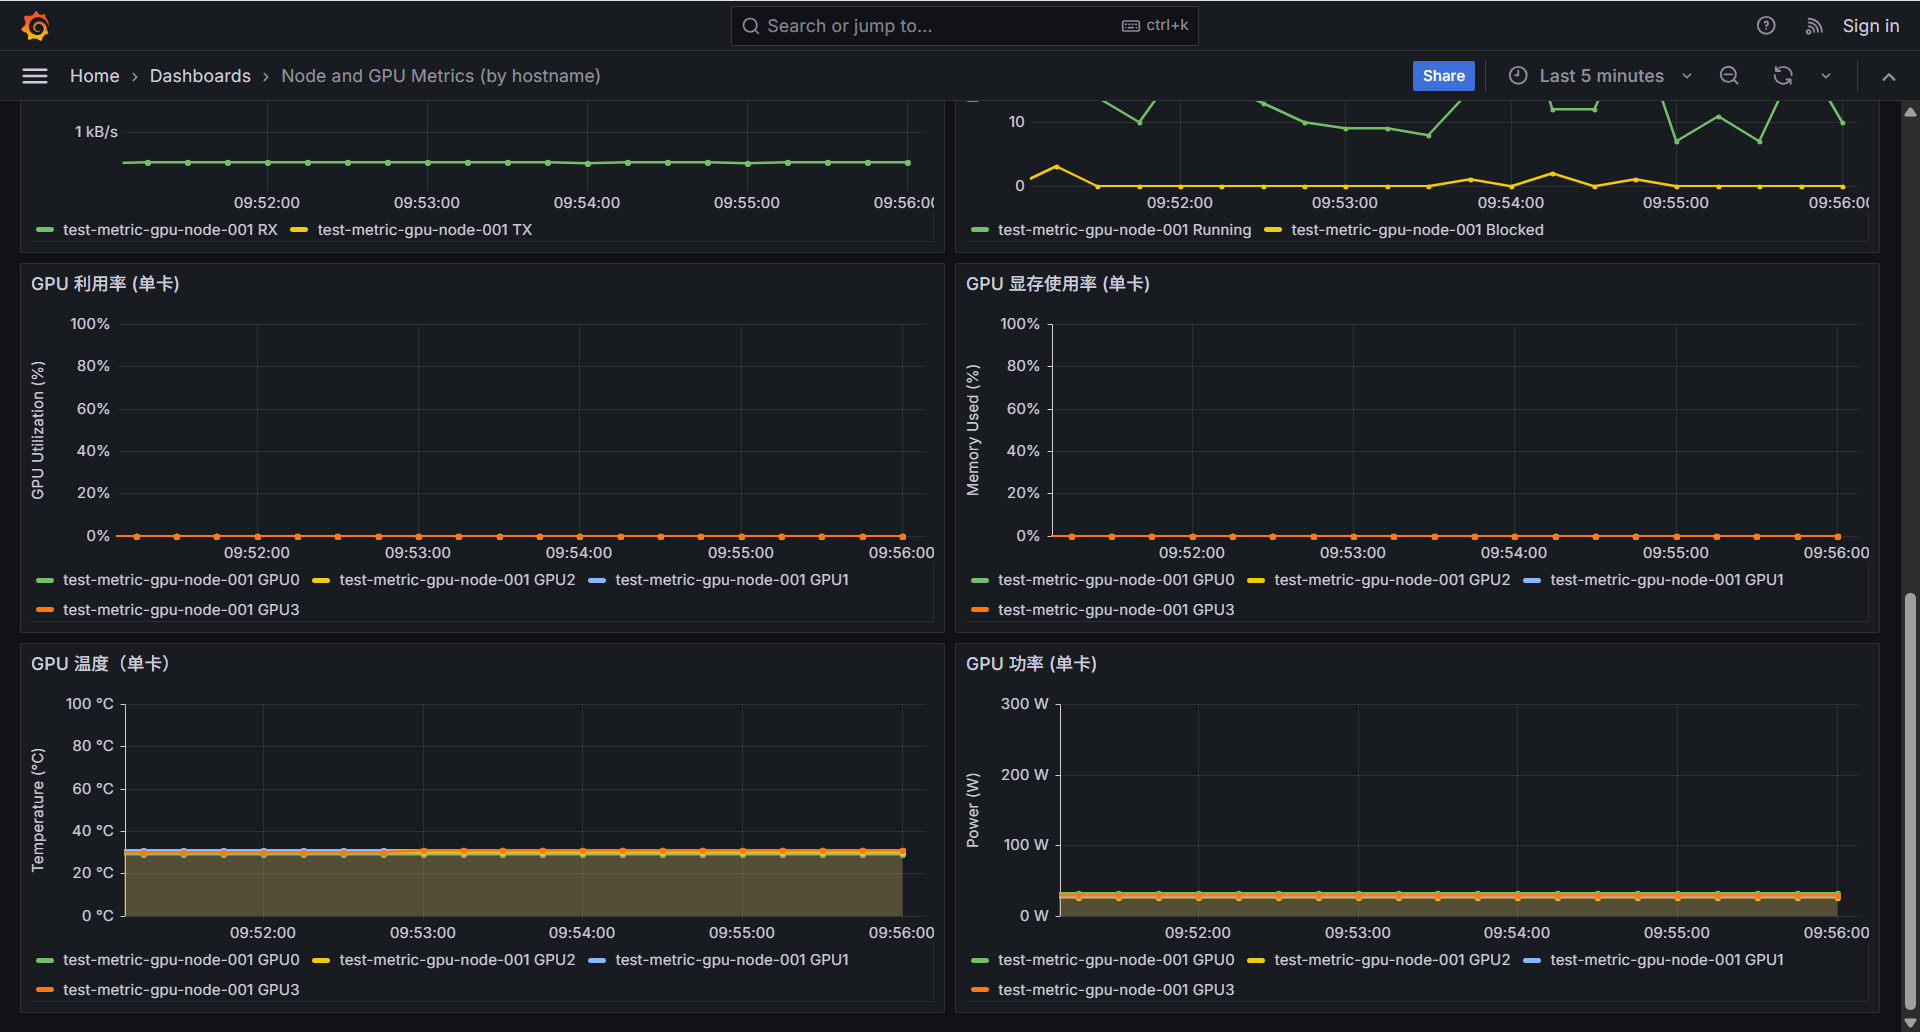 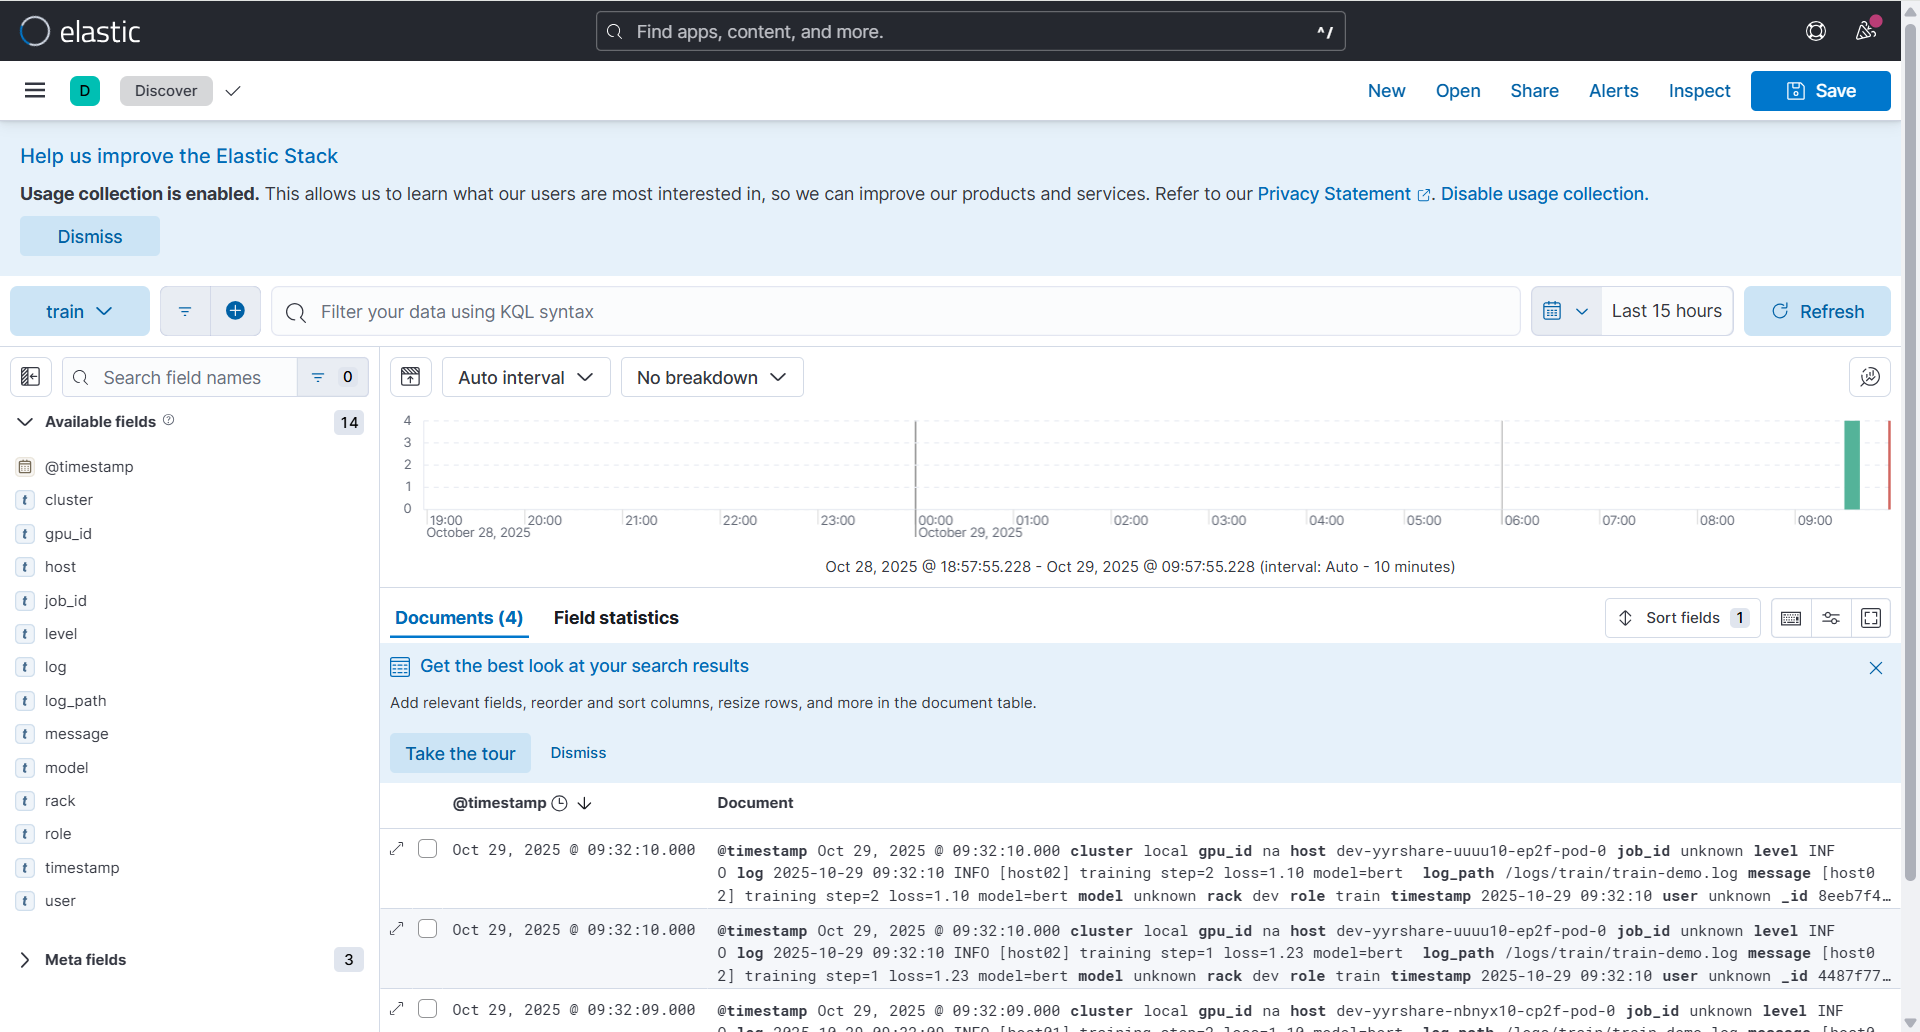 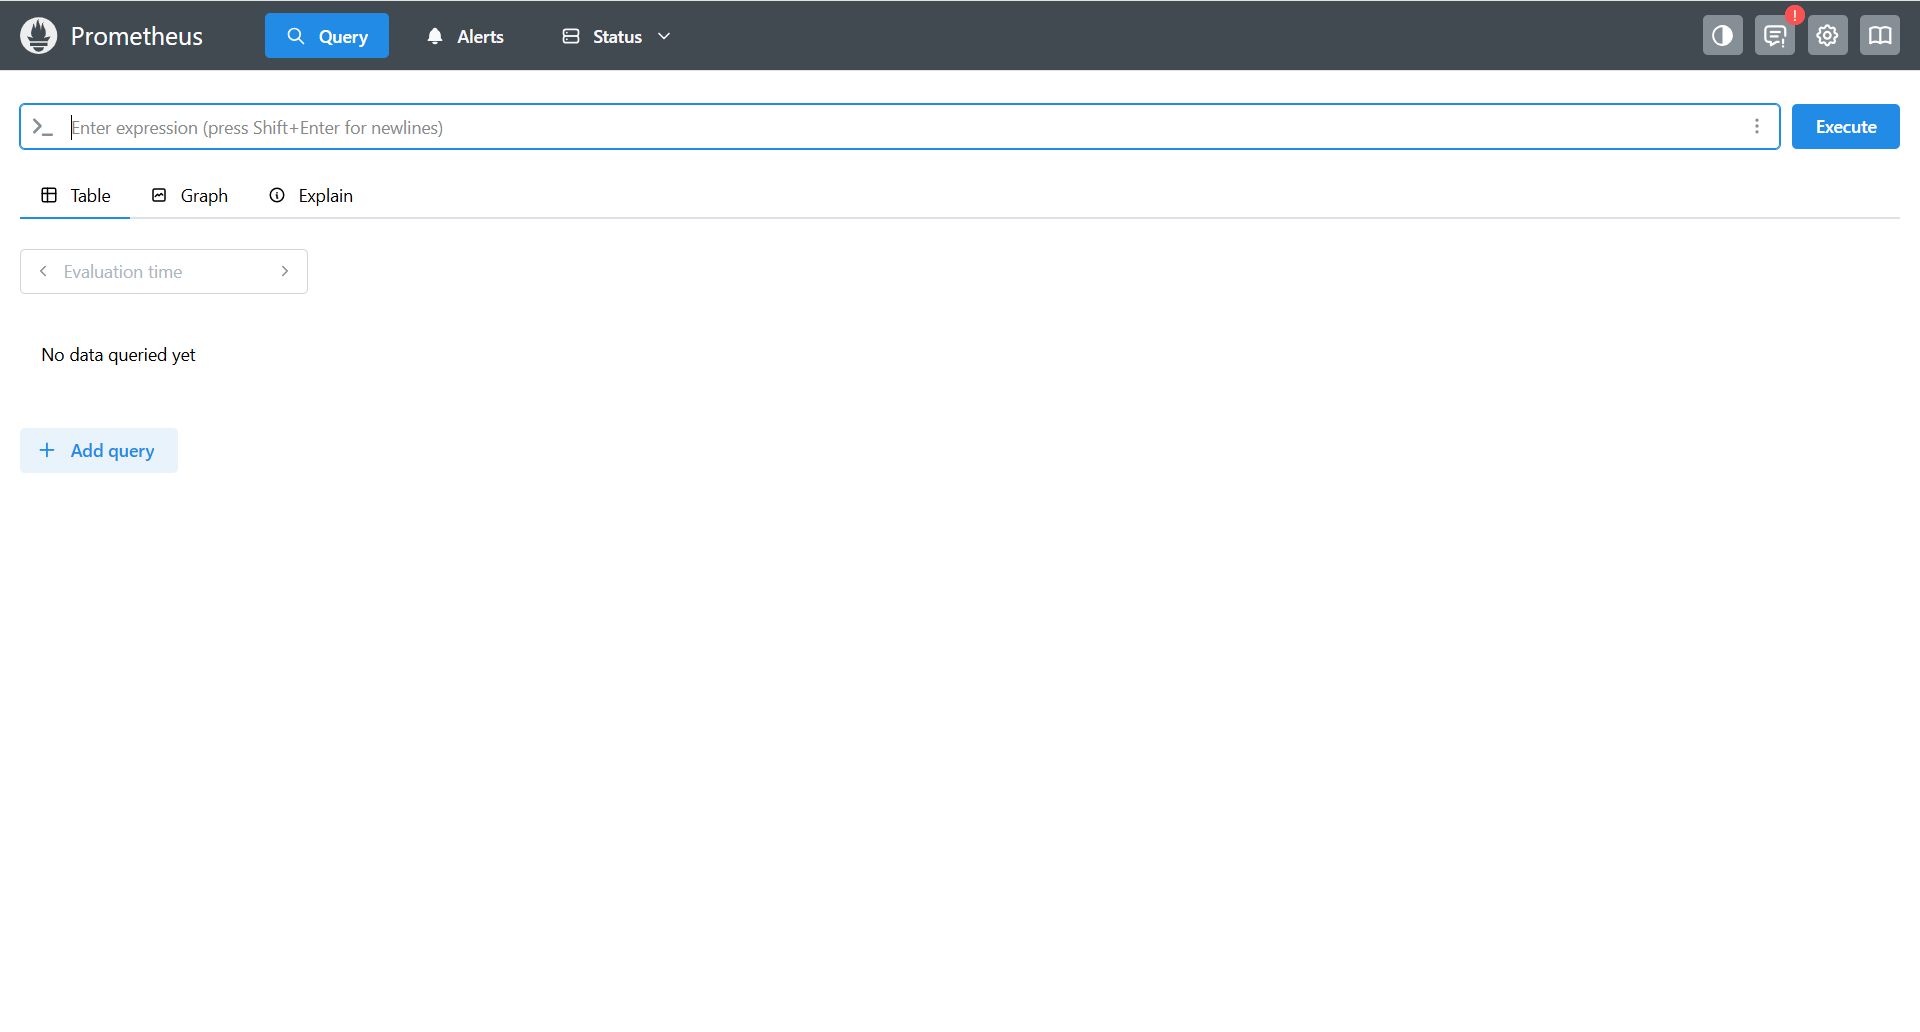 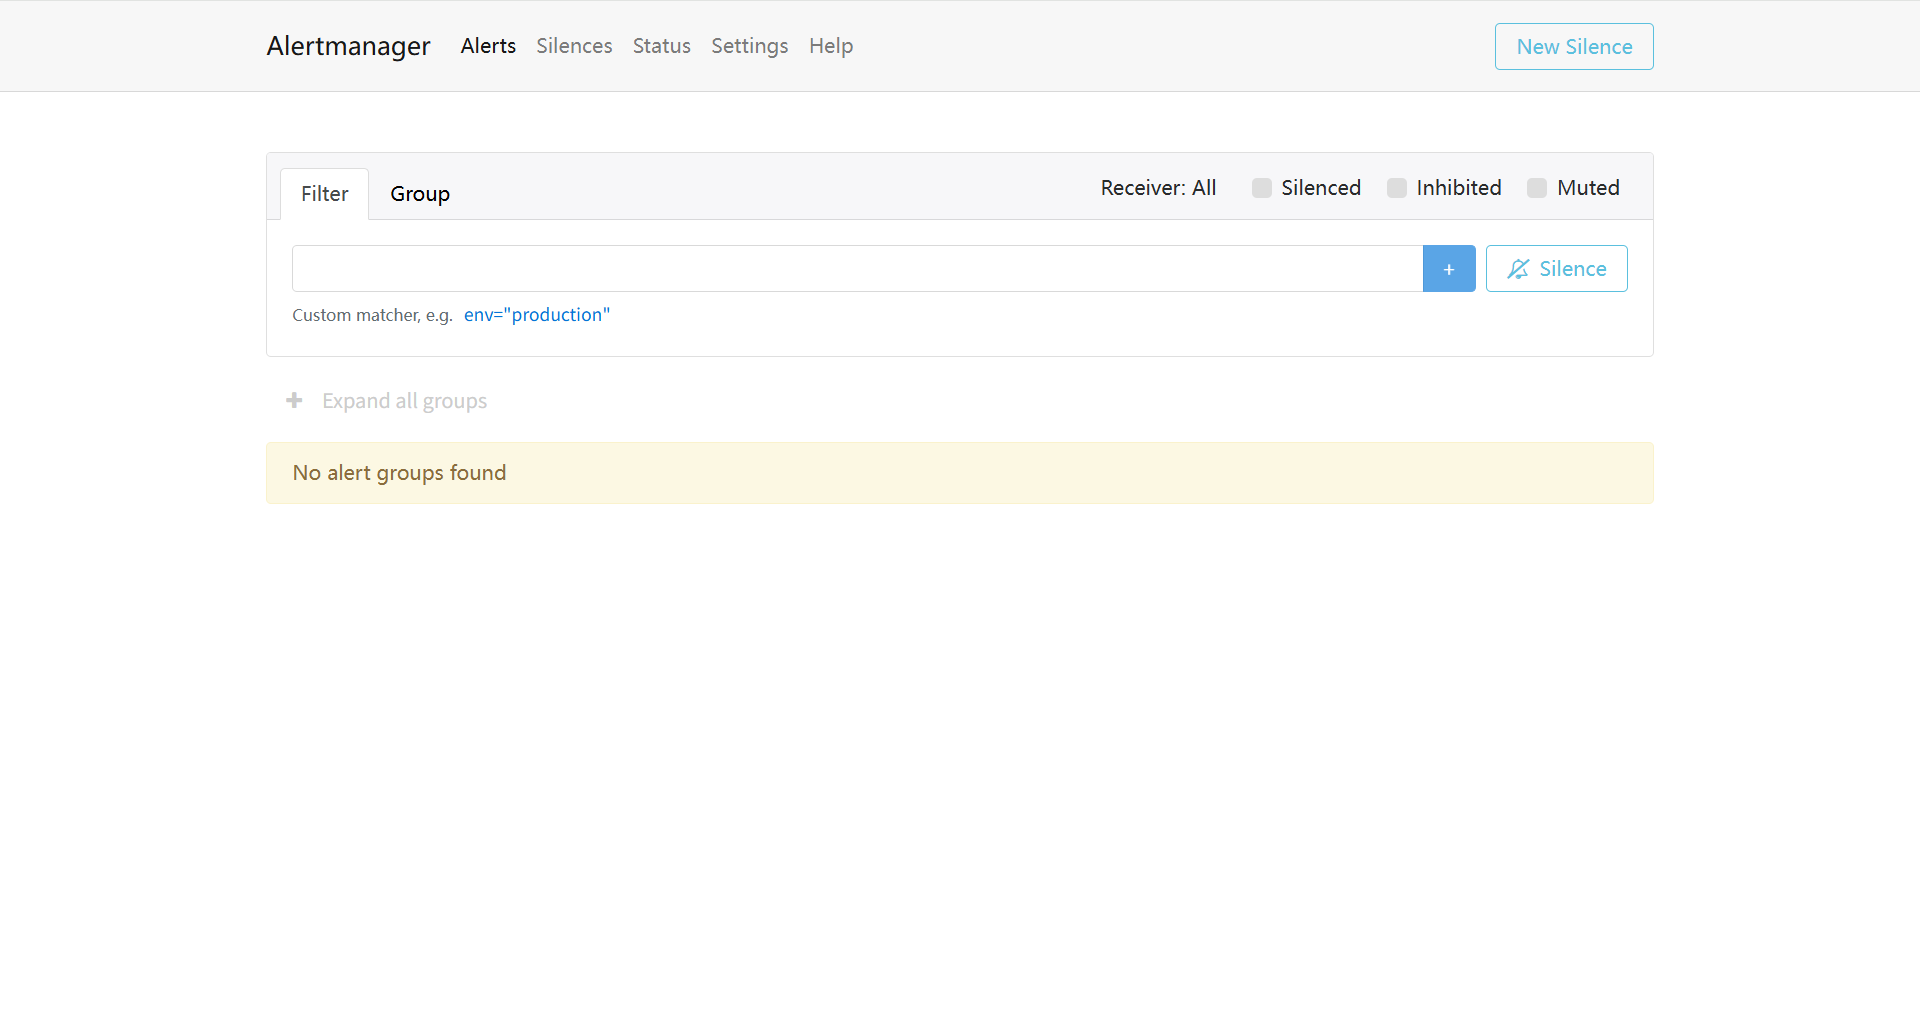 端到端测试通过: 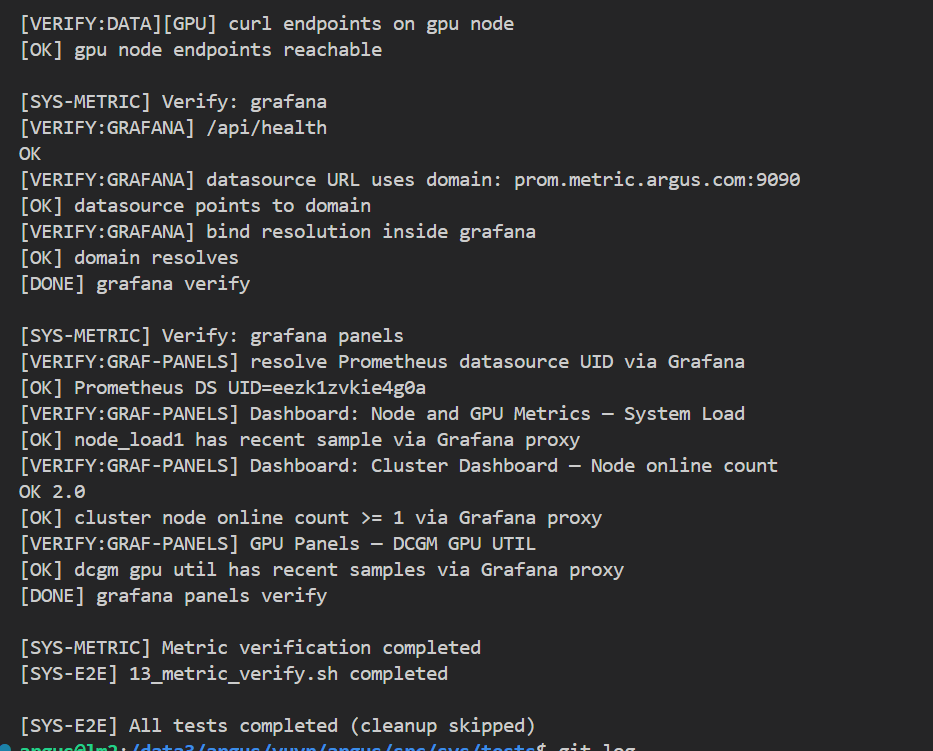 Co-authored-by: sundapeng.sdp <sundapeng@hashdata.cn> Reviewed-on: #35 Reviewed-by: xuxt <xuxt@zgclab.edu.cn> Reviewed-by: sundapeng <sundp@mail.zgclab.edu.cn> Reviewed-by: huhy <husteryezi@163.com>
88 lines
3.0 KiB
Bash
Executable File
88 lines
3.0 KiB
Bash
Executable File
#!/usr/bin/env bash
|
||
set -euo pipefail
|
||
|
||
SCRIPT_DIR="$(cd "$(dirname "${BASH_SOURCE[0]}")" && pwd)"
|
||
TEST_ROOT="$(cd "$SCRIPT_DIR/.." && pwd)"
|
||
TMP_DIR="$TEST_ROOT/tmp/metric-verify"
|
||
mkdir -p "$TMP_DIR"
|
||
|
||
# 载入端口变量
|
||
if [[ -f "$TEST_ROOT/.env" ]]; then
|
||
set -a; source "$TEST_ROOT/.env"; set +a
|
||
fi
|
||
|
||
GRAF="http://localhost:${GRAFANA_PORT:-3000}"
|
||
HOSTNAME="${METRIC_TEST_HOSTNAME:-test-metric-node-001}"
|
||
|
||
echo "[VERIFY:GRAF-PANELS] resolve Prometheus datasource UID via Grafana"
|
||
DS_JSON="$TMP_DIR/graf_ds.json"
|
||
curl -fsS --max-time 10 "$GRAF/api/datasources" >"$DS_JSON"
|
||
DS_UID=$(python3 - "$DS_JSON" <<'PY'
|
||
import json,sys
|
||
arr=json.load(open(sys.argv[1]))
|
||
for ds in arr:
|
||
if (ds.get('type')=='prometheus'):
|
||
print(ds.get('uid',''))
|
||
break
|
||
PY
|
||
)
|
||
if [[ -z "$DS_UID" ]]; then echo "[ERR] no prometheus datasource found in grafana" >&2; exit 1; fi
|
||
echo "[OK] Prometheus DS UID=$DS_UID"
|
||
|
||
proxy_query() {
|
||
local q="$1"; local out="$2"
|
||
curl -fsS --max-time 10 --get "$GRAF/api/datasources/proxy/uid/$DS_UID/api/v1/query" \
|
||
--data-urlencode "query=$q" >"$out"
|
||
}
|
||
|
||
assert_vector_recent_nonempty() {
|
||
local json="$1"; local max_age_sec="${2:-180}"
|
||
python3 - <<'PY' "$json" "$max_age_sec"
|
||
import json,sys,time
|
||
doc=json.load(open(sys.argv[1]))
|
||
if doc.get('status')!='success':
|
||
raise SystemExit('prom status != success')
|
||
res=doc.get('data',{}).get('result',[])
|
||
assert res, 'empty result'
|
||
ts=float(res[0]['value'][0])
|
||
assert time.time()-ts < float(sys.argv[2]), f'timestamp too old: {ts}'
|
||
print(int(ts))
|
||
PY
|
||
}
|
||
|
||
echo "[VERIFY:GRAF-PANELS] Dashboard: Node and GPU Metrics — System Load"
|
||
Q_NODE_LOAD="node_load1{hostname=\"$HOSTNAME\"}"
|
||
proxy_query "$Q_NODE_LOAD" "$TMP_DIR/graf_panel_node_load.json"
|
||
assert_vector_recent_nonempty "$TMP_DIR/graf_panel_node_load.json" 300 >/dev/null
|
||
echo "[OK] node_load1 has recent sample via Grafana proxy"
|
||
|
||
echo "[VERIFY:GRAF-PANELS] Dashboard: Cluster Dashboard — Node online count"
|
||
Q_NODE_ONLINE='count(count by(hostname) (up{job="node"} == 1))'
|
||
proxy_query "$Q_NODE_ONLINE" "$TMP_DIR/graf_panel_node_online.json"
|
||
python3 - "$TMP_DIR/graf_panel_node_online.json" <<'PY'
|
||
import json,sys
|
||
doc=json.load(open(sys.argv[1]))
|
||
assert doc.get('status')=='success', 'prom status not success'
|
||
res=doc.get('data',{}).get('result',[])
|
||
assert res, 'no series for node online count'
|
||
val=float(res[0]['value'][1])
|
||
assert val>=1, f'node online < 1: {val}'
|
||
print('OK',val)
|
||
PY
|
||
echo "[OK] cluster node online count >= 1 via Grafana proxy"
|
||
|
||
if [[ -f "$TEST_ROOT/.env" ]]; then
|
||
set -a; source "$TEST_ROOT/.env"; set +a
|
||
fi
|
||
|
||
# 可选:GPU 面板查询(当启用 GPU 时)
|
||
if [[ "${ENABLE_GPU:-false}" == "true" ]]; then
|
||
echo "[VERIFY:GRAF-PANELS] GPU Panels — DCGM GPU UTIL"
|
||
Q_GPU_UTIL='DCGM_FI_DEV_GPU_UTIL'
|
||
proxy_query "$Q_GPU_UTIL" "$TMP_DIR/graf_panel_dcgm_util.json"
|
||
assert_vector_recent_nonempty "$TMP_DIR/graf_panel_dcgm_util.json" 300 >/dev/null || { echo "[ERR] dcgm gpu util no recent sample via Grafana proxy" >&2; exit 1; }
|
||
echo "[OK] dcgm gpu util has recent samples via Grafana proxy"
|
||
fi
|
||
|
||
echo "[DONE] grafana panels verify"
|